
Hey! Welcome to the first post of my “Mauka Showers” blog! Thanks for checking it out! I’ve been retired from the National Weather Service for over a couple of months now and have been slowly setting up this whole blog thing since my last day of work on April 30. Getting everything squared away was a bit more than I expected, but I think I’m good to go now.
Since we’re about midway through the May through September dry season (kau) for the Hawaiian Islands, I thought a good first post would be to recap some of the weather highlights that have occurred during the first half. Note that the term “dry season” in Hawaiʻi refers to everywhere in the state except the Kona slopes of the Big Island. The Kona slopes region is unique in that it’s the only area in the Hawaiian Islands with a distinct wet season in the summer months. I’ll likely cover this in more detail in a later post.
Overall, a trade wind weather pattern dominated conditions across the main Hawaiian Islands during the first half of the dry season. This is not surprising since the trade winds have their highest frequency of occurrence (around 90% on average) during our summer months. In this type of pattern, the east-facing windward slopes have rainfall just about every day, with the amounts per day usually modulated by changes in things such as the amount of low level moisture, the middle and upper tropospheric stability, and the passage of sub-synoptic scale features embedded within the trades.
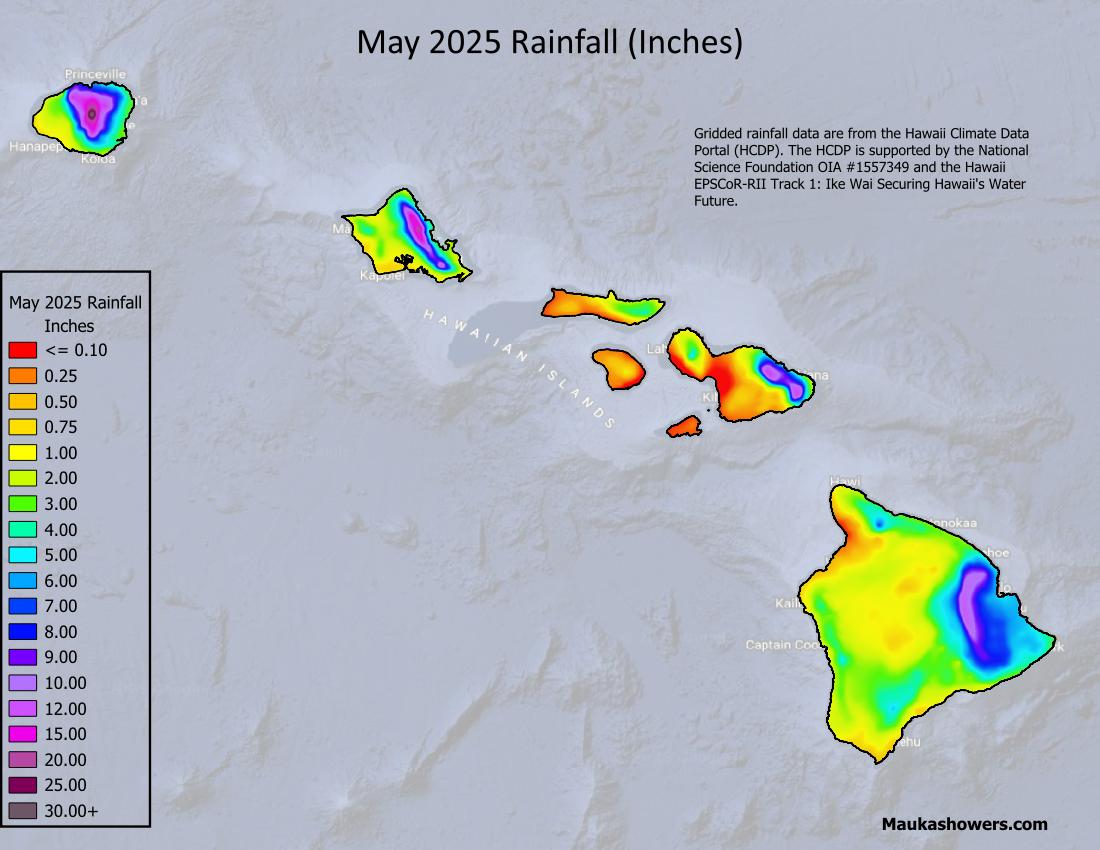
During May, Kauaʻi and Oʻahu had average to above-average rainfall overall, while most of Maui County and the Big Island had below average rainfall. The Kona slopes region was the main exception on the Big Island where several gages reported totals of more than 2 to 3 times their May average, indicating a very robust start to their wet season.

May 2025 rainfall in inches using gridded data from the Hawaii Climate Data Portal (HCDP).
In mid-May, enhanced rainfall occurred over many areas of the state. According to the May edition of the Honolulu Forecast Office’s Monthly Precipitation Summary, several sites had their highest daily totals of the month during this period. The loop below shows 24-hour estimated rainfall totals ending at midnight (HST), May 14 to midnight, May 21. You can see how the areas of enhanced totals in green (0.50” to 2.00”) increase over several areas of the state from May 16 through May 18. This boost in rainfall was due to a low pressure system aloft that increased the instability over the island chain.

Loop of Pass 2 24-hr rainfall using screen captures from the NOAA National Severe Storms Lab’s Multi-Radar/Multi-Sensor (MRMS) system website. The images were cropped for visual clarity.
The rainfall totals in the loop were derived using radar rainfall estimates combined with rain gage data to help account for biases in the radar estimates and gaps in the radar data coverage. MRMS also blends the data from the four WSR-88D weather radars across the state to provide a seamless mosaic. It is a very nice way to view weather radar data. You can view the entire suite of MRMS products at this link.
You may have noticed in the loop that there was a day where even the leeward side of Oʻahu got into the action. There was enough instability aloft to support thunderstorm development during the afternoon of May 17, with the U.S. Geological Survey’s rain gage at Mākaha Stream recording 1.36 inches during the period from 4:00 PM to 5:45 PM HST. Another MRMS image, this time showing hybrid scan reflectivity centered over Oʻahu at 5:08 PM HST, May 17, is included in the following figure. The area of orange and even a few specks of red shows the most intense portion of the thunderstorm cell over the Mākaha and Mākua Valley areas in west Oʻahu. It wasn’t the most intense cell in the world, but not bad for leeward Oʻahu in May. According to the Honolulu Forecast Office, there was enough rain to warrant issuance of a Flood Advisory, but not enough to produce significant flooding impacts.

Screen capture of MRMS Seamless Hybrid Scan reflectivity data from 5:08 PM HST, May 17, 2025, showing the location of heavy rainfall from a thunderstorm over west Oʻahu.
June conditions across the state were similar to May, except that the low pressure systems aloft were mainly far to the west. Overall, Kauaʻi had mostly average to above average totals, and Oʻahu and Maui County had mostly below average totals. The Kona slopes region of the Big Island was very much above average, and the rest of the island was mostly average to below average. Rainfall occurred often along the windward slopes, especially over the lower Puna and South Hilo Districts of the Big Island. Several rainfall observers from the Puna District in the Community Collaborative Rainfall, Hail, and Snow (CoCoRaHS) network recorded measurable rainfall (at least 0.01 inches) daily in June.

June 2025 rainfall in inches using gridded data from the Hawaii Climate Data Portal (HCDP).
Far away from the main Hawaiian Islands, there were a couple of items from the first half of the dry season that I thought were worth mentioning. The first is that there appeared to be a kona low near Midway Atoll far northwest of Kauaʻi. It was too far to have any significant impacts on Hawaiʻi’s residents, but it marked the second consecutive year with a kona low in May. These systems, also known as subtropical cyclones, are seen more frequently in the central North Pacific during the October through April wet season. In mid-May 2024, a kona low occurred much closer to the state, resulting in heavy rainfall and flash flooding on several islands. It was also the latest kona low to have direct impacts to the main Hawaiian Islands in over 20 years. In a synoptic climatology paper by Otkin and Martin (2004), kona lows in May accounted for only 4 percent of the total in their sample period, so it’s not very common.


(Top) Surface analysis from the National Weather Service’s Ocean Prediction Center at 1200 UTC, May 7, 2025. The lower center of the map shows the location of where the center of the kona low was located. The low was south of the subtropical ridge, completely separated from the polar westerlies. (Bottom) Geopotential heights and winds from the GFS model’s 00-hr panel valid at 1200 UTC, May 7, 2025. The area left of center show the location of the kona low’s center aloft.
The second item involves the East Pacific tropical cyclone season. As many of you know, the Central North Pacific (north of the equator, from 140W longitude to the International Dateline) tropical cyclone season runs from June 1 through November 30. However, the East Pacific season (east of 140W) actually starts on May 15 due to the earlier average development date of the first tropical cyclone in the basin. This year, it wasn’t the start date of the first tropical cyclone that was unusual (TD-1E/Alvin on May 28), but the high number of early season systems. By June 29, the East Pacific had its sixth named tropical cyclone (Flossie). According to data from the National Hurricane Center, the East Pacific basin doesn’t typically have its sixth named system until August 3! Flossie dissipated as a tropical cyclone on July 3, and since then it has been very quiet tropical cyclone-wise. The peak of the tropical cyclone season is still coming up, so we can’t be complacent due to the current lack of activity. Prepare now and have a plan!

NOAA/NESDIS GOES infrared image loop from 1910-2100 UTC, June 8, 2025 showing tropical cyclones Barbara and Cosme in the far eastern Pacific.
I think that’ll do it for my first post. It’ll probably take a while to get a feel for what the right length should be, and how long it takes to produce. My initial feeling is that this first post went a bit long so I’ll probably shorten it up for the next one. In the meantime, take care and stay safe!
Reference
Otkin, J., and J. E. Martin, 2004: A synoptic climatology of the subtropical kona storm. Monthly Weather Review, 132, 1502-1517.