Last week it looked like this week’s (December 14th – 20th) weather pattern was going to have rather wet conditions over Kauaʻi, Oʻahu, and possibly the western portion of Maui. The cause of these conditions was a split in the jet stream due to a nearly stationary blocking pattern aloft over the Aleutian Islands. The more energetic southern branch of the jet shifted close to the Hawaiian Islands, with several disturbances aloft triggering periods of thunderstorm and heavy rainfall activity.
The peak of the rain event was expected to be on Sunday and Monday, December 14 and 15, with some of the models showing additional episodes of enhanced rainfall later in the week. The panel below is from my December 12 blog post and shows the 5-day forecasted precipitation accumulation ending at 2 AM HST, December 17 from the ECMWF model.

Accumulated precipitation for the 5-day period ending at 2 AM HST, December 17, 2025 from the ECMWF model. The graphic is produced byTropicaltidbits.com.
We had two main episodes of rainfall activity earlier in the week, the first on December 14th and 15th, and the second on December 17th and 18th. It looks like we’re in the middle of a third with today’s rainfall that could continue into early Saturday, December 20th (if the models are correct). In the first episode, models projected that the highest rainfall amounts would occur over Kauaʻi mainly late Sunday and into Monday morning. It ended up playing out quite differently, with most of the rainfall occurring along a nearly stationary frontal boundary over Oʻahu on Sunday. The surface analysis map below shows the frontal boundary in the lower right near Oʻahu at 2 AM HST on Sunday, December 14. Below the map is a NOAA/NESDIS GEOCOLOR image loop showing the active portion of the frontal band over the southeastern half of the island.

Surface analysis from 2 AM HST, December 14, 2025, posted by the Honolulu Forecast Office (HFO). The line near Oʻahu (lower right) with alternating blue triangles and red half circles marks the position of a stationary front.

NOAA/NESDIS GEOCOLOR loop from the morning of Sunday, December 14, 2025. Further information on the GEOCOLOR composite can be found here.
The Multi-Radar/Multi-Sensor (MRMS) composite reflectivity image below from 1 PM HST on Sunday shows the heaviest cores over Honolulu that resulted in urban flooding. Note that this is a degraded radar picture of the situation due to the lack of data from the Molokaʻi WSR-88D radar feeding into the MRMS mosaic. The Molokaʻi radar has been down for some time and would have been the best to see precipitation over Oʻahu. Being farther away, the South Kauaʻi radar is sampling a much higher slice in the atmosphere over Oʻahu and would miss the stronger cores in the lower levels.

Composite reflectivity mosaic for 1 PM HST, Sunday, December 14, 2025 from the NOAA National Severe Storms Lab’s Multi-Radar/Multi-Sensor (MRMS) system website. The image from the website was cropped for visual clarity.
Conditions settled down on Tuesday, but the models were indicating that another shortwave trough would move in and destabilize the atmosphere again on Wednesday and Thursday along a surface trough near Oʻahu. The figure below is a precipitation forecast from the NWS’ ARW high resolution model for the 48-hour period ending at 2 AM HST on Thursday, December 18. Oʻahu is blotted out by a swath of rainfall with totals of 3 to 8+ inches. Other high resolution models showed variations of the same theme.

Graphic of the 48-hour accumulated precipitation from the Hawaiʻi domain of the high resolution ARW model. The graphic was downloaded from the NWS’ Model Analyses and Guidance (MAG) webpage.
The peak of this second episode ended up coming in a little later than forecasted by the models and hit the west side of Oʻahu on the morning of Thursday, December 18. The satellite loop below, which is also a GEOCOLOR loop like the one above, shows a southwest- to northeast-oriented band of showers and thunderstorms over Oʻahu. The white blobs in the IR portion of the loop show the locations of the cumulonimbus clouds. The MRMS radar mosaic below the loop shows the locations of the strongest rainfall cores, including one just offshore from Waiʻanae.

Same as above, but for the morning of Thursday, December 18.

Same as in MRMS composite reflectivity image above, but for 3 AM HST, Thursday, December 18.
Rainfall totals came in at 2 to 5 inches for the 24-hour period ending at 8 AM HST on Thursday. While the amounts didn’t quite reach 8 inches and came in a little later than expected, I’d still say the short range model forecasts from Tuesday were pretty good.
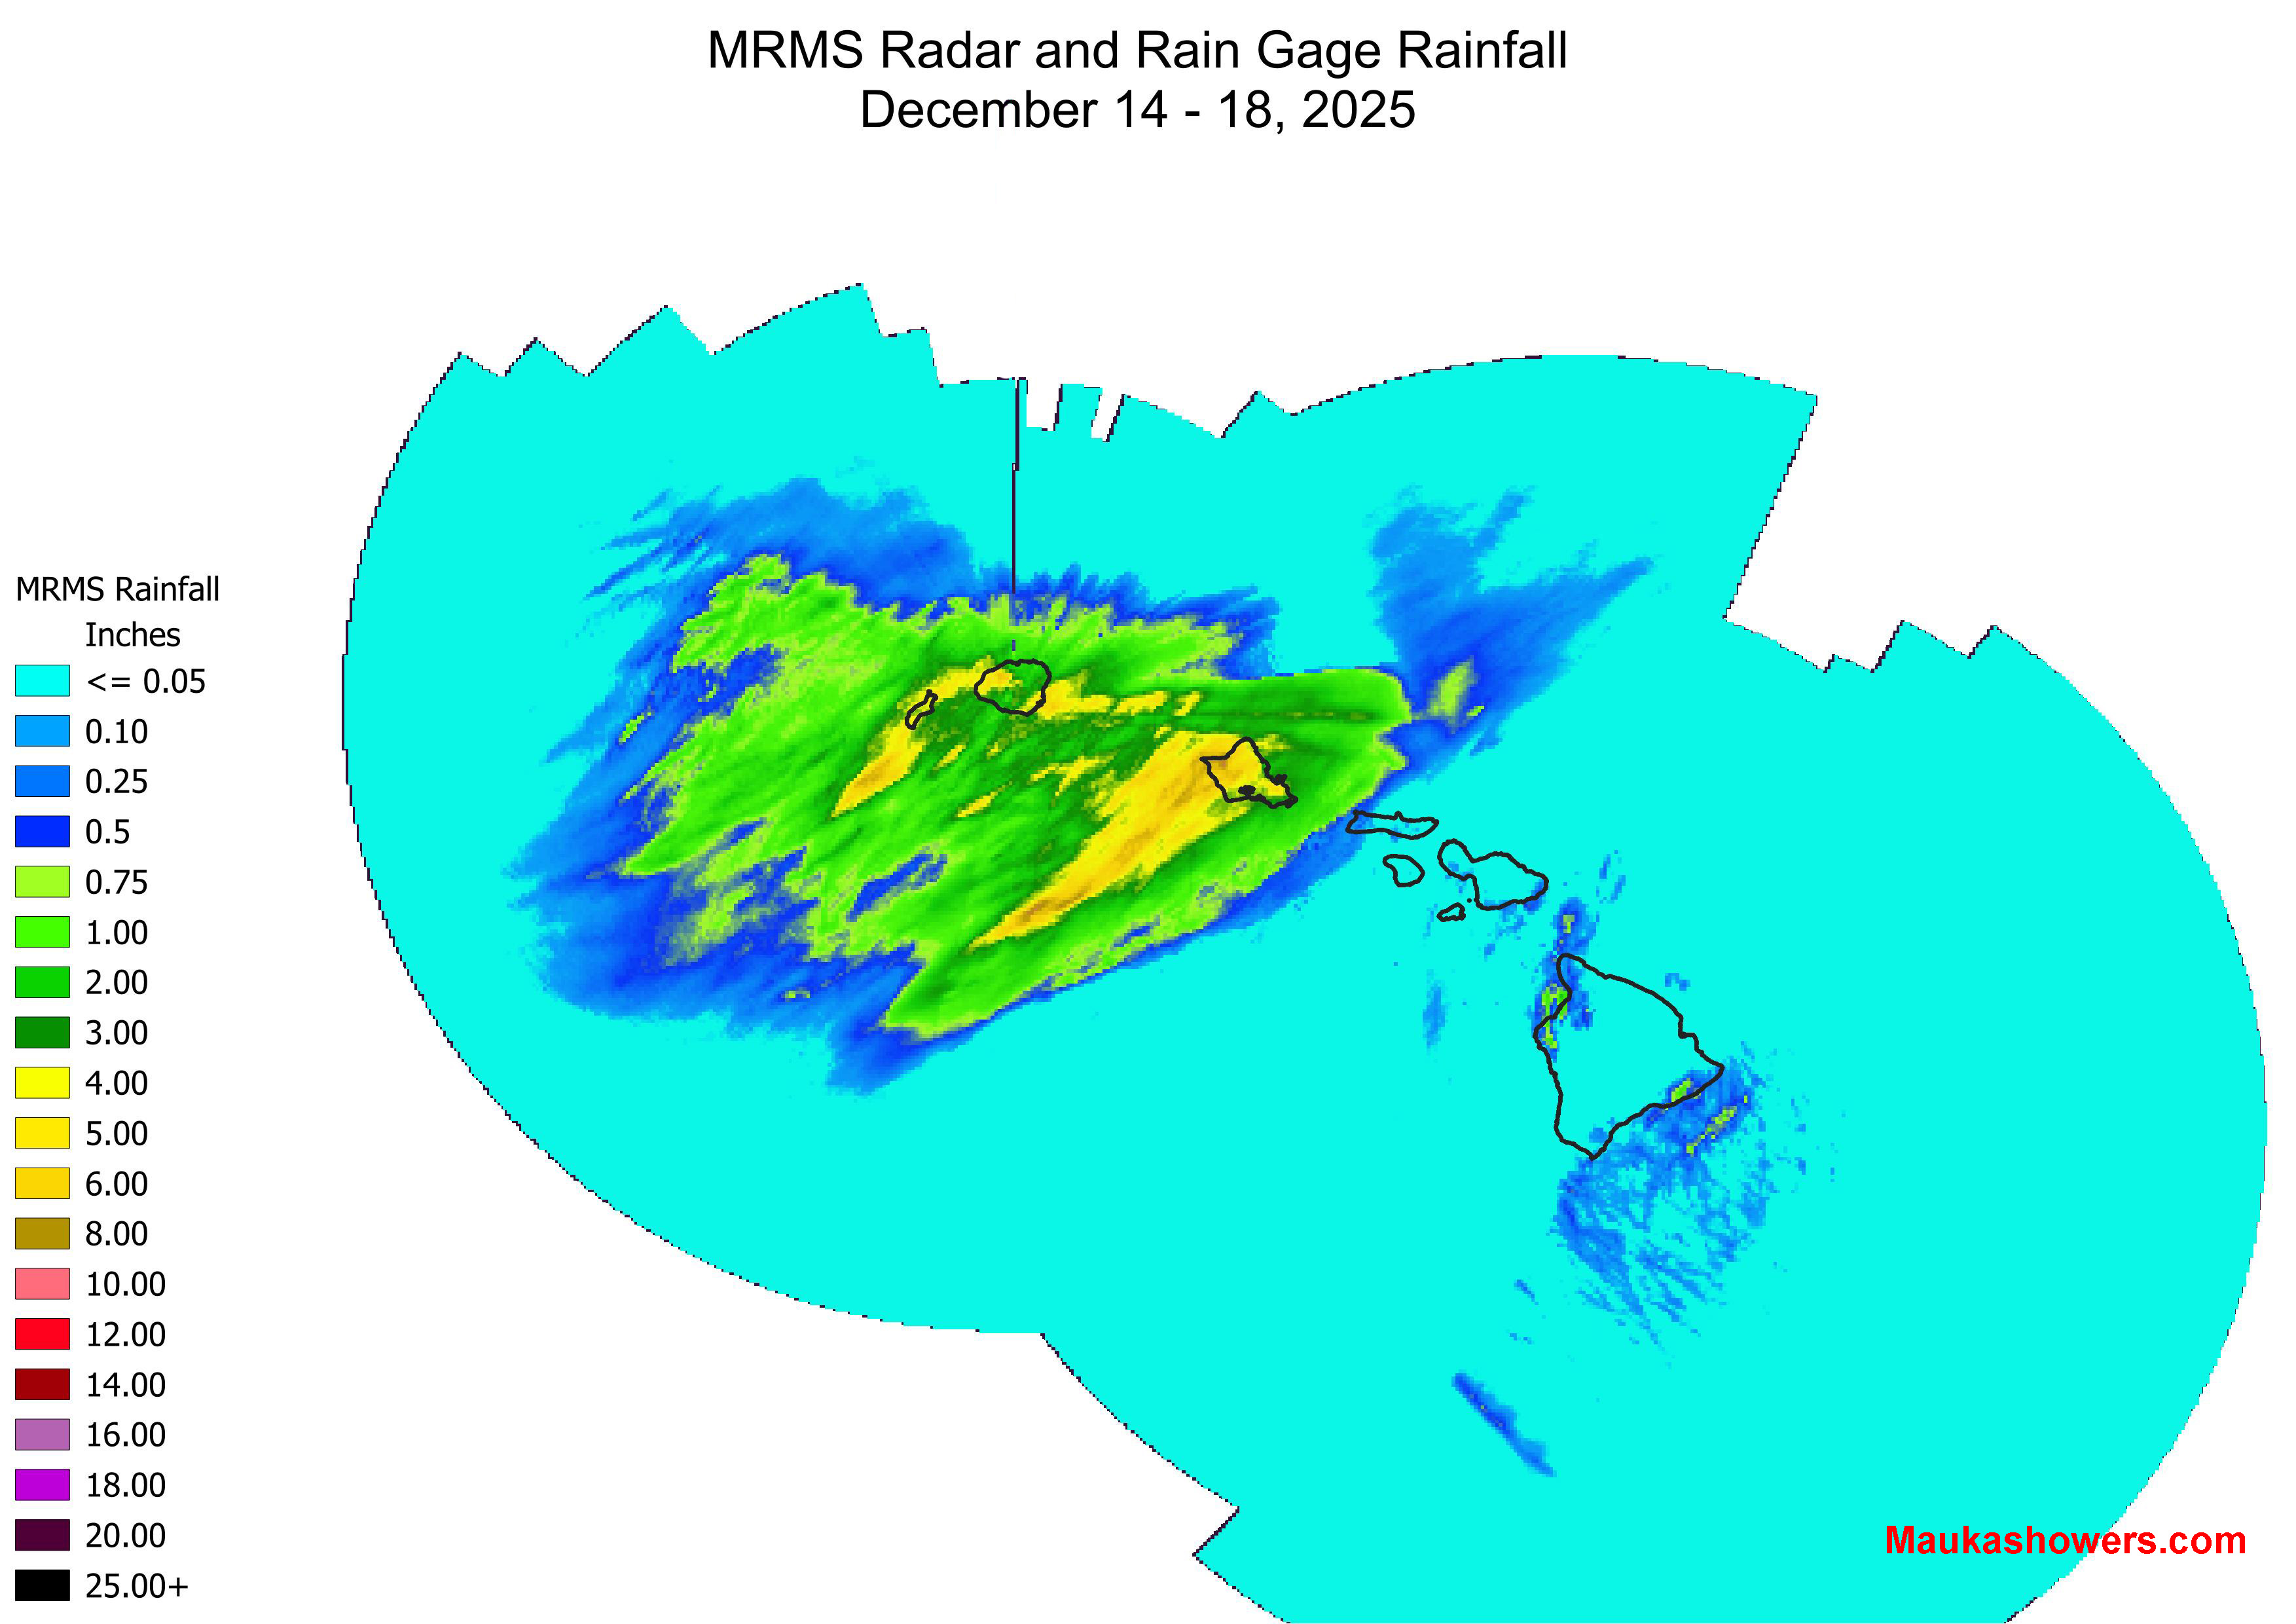
The MRMS 5-day combined radar and rain gage analysis (“Pass 2” data) covering December 14th through the 18th is included below. The largest swath extending from Oʻahu towards the southwest has totals of 4 to 8+ inches. Model forecasts from last week ended up getting the big picture pretty good, with most of the rain over Kauaʻi and Oʻahu, and much less occurring over the Big Island and Maui County.

MRMS 5-day accumulated precipitation covering December 14th through December 18th. The MRMS website only provides up to 3-day totals so the data in this graphic were downloaded from the MRMS repository on the Registry of Open Data on AWS and processed using QGIS software.
Based on Honolulu Forecast Office (HFO) Preliminary Local Storm Report (LSR) data, flooding impacts appeared to be the worst on Sunday, December 14. In addition to creating rather wet conditions for the Honolulu Marathon, periods of heavy rainfall resulted in urban flash flooding issues with two water evacuations reported over windward Oʻahu and one water rescue in Honolulu (Kalihi). Social media posts also showed numerous flooded roads in the Honolulu area, including several sections of the H-1 Freeway. Bouts of heavy rain over Kauaʻi on December 15th and 17th, and over Oʻahu on December 18th do not appear to have resulted in significant flooding problems based on the information I saw.
The event appears to be a little more persistent than the models expected last week and is still ongoing as I publish this post. This morning, strong thunderstorms moved over and near Kauaʻi, with one cell prompting a brief Tornado Warning for Kauaʻi County. Areas of heavy rainfall are still southwest of Oʻahu and in the Kauaʻi Channel. I still want to get this post out today so
I’ll have a final summary next week that will include the full event totals, along with other tidbits that will have the benefit of more time for data analysis. Stay tuned!
2 responses to “Recap – Our First Big Rain Event of the Wet Season”
[…] than 8 inches, are within the main band extending from west Oʻahu toward the southwest. Recall from last week’s post that the numbers over the mid-section of the state are degraded due to the lack of data from the […]
[…] being generally dry. As mentioned in previous posts, this is consistent with recent trends. The December 14-20, 2025 event was the first significant heavy rain event of the season. The main impacts occurred early-on with […]