
I don’t know about you, but it’s pretty amazing to me that we’re already about halfway through the 2026 May through September dry season. In a couple of weeks it’ll be Christmas, or at least it will feel that way! With that in mind, I think it’s a good time to see where we’re at in terms of rainfall, and take a look at what the next several months may have in store for folks in the Hawaiian Islands.
The map below shows the percent of average rainfall for May and June 2026. When I created the graphic, I was struck by how wet it has been over the past couple of months. At first I thought I applied the wrong color map. Then I checked the raw rainfall numbers at more sites than I usually do. It all seems to check out fine.

Percent of average rainfall for May and June across the main Hawaiian Islands. Rainfall data are from the Hawaiʻi Climate Data Portal (HCDP). Average rainfall values were from the HCDP’s Rainfall Atlas of Hawaiʻi.
So what produced all this rain? In a broad sense, we’ve had wetter than usual trade winds, including a few trade wind disturbances that boosted rainfall amounts along the windward slopes of the state. One of the better defined examples can be seen in the GOES-18 visible image loop below from June 28. Old school meteorologists in Hawaiʻi used to call these features “screaming eagles” because they looked like (maybe after a few drinks) an eagle about to pounce on some prey. Personally, I can see the eagle without beverages, but maybe that’s just me.

NOAA/NESDIS visible image loop centered on the main Hawaiian Islands from Sunday, June 28, 2026 showing a trade wind disturbance just east of the Big Island.
Several weak low level pressure troughs embedded within the overall trade wind flow also moved over the island chain to help boost rainfall. Looking at Hilo Airport’s data from June, the number of days with measurable rain (at least 0.01 inches) was right around normal (25 days compared to a long term average of 25.4 days), but the amount of rain per day was well above normal (0.38 inches per day vs. a long term average of 0.24 inches per day).
Along with the overall wet trade wind conditions, there were a couple of low pressure systems aloft that produced some heavy rainfall over portions of the state. The biggest, in terms of intensity and impacts occurred on May 15 over Oʻahu. The unstable conditions from the transient low aloft produced thunderstorms with rain rates as high as 8+ inches per hour. Residents in Kunia even reported small hail. The loop below shows numerous lightning flashes over Oʻahu during the peak of the event. Bouts of heavy rain like this can really skew the percent of average numbers when they occur in the dry season.

NOAA/NESDIS visible image loop centered on the main Hawaiian Islands with Geostationary Lightning Mapper (GLM) data overlaid. The loop covers the period from 1:01 PM to 3:01 PM HST, May 15, 2026. For more information on the GLM data, please click here.
In terms of drought, the main Hawaiian Islands were in pretty good shape heading into the dry season. The U.S. Drought Monitor (USDM) map from May 5 (below) showed no drought areas in the state, and just a couple of D0 areas (“abnormally dry”, technically not drought). In my opinion, the USDM map should have been completely blank considering we just ended one of the wettest wet seasons in the last 30 years! The latest USDM map, valid for July 7, is still drought-free over Hawaiʻi, but still shows some D0 over the Big Island and Maui. One of the D0 areas covers Kahului Airport, which has 120% of average rainfall for May and June! Is that “abnormally dry”? C’mon, man!

U.S. Drought Monitor map for the main Hawaiian Islands as of May 5, 2026. The D1-D4 categories are the different levels of drought. The D0 category, for abnormally dry conditions, can be considered as “pre-drought”.

Same as above but for July 7.
What about the rest of the dry season? The next several months, and even into early 2027, will likely depend on the El Niño event that’s currently developing in the tropical Pacific. Following weak La Niña conditions early this year, the equatorial Pacific quickly warmed over the last couple of months, most notably in the Nino3.4 region (5N-5S latitude, 120-170W longitude) where ENSO is monitored. The loop below shows sea surface temperature (SST) anomalies have increased considerably over the past several weeks, and will likely continue to do so over the next few months.

Relative sea surface temperature anomalies over the tropical Pacific from April 15 to July 1, 2026 . The analysis is from the Climate Prediction Center (CPC). The red box has been added to delineate the Nino3.4 region.
The latest Climate Prediction Center (CPC) diagnostic discussion, issued on July 9, expressed “very high confidence that El Niño will continue through early 2027.” Considering the seasonal El Niño Southern Oscillation (ENSO) probabilities in the graph below, even “very high confidence” seems to be a bit of an understatement! The ENSO strength probabilities graph (second graph below) shows an 81% chance for a “very strong” El Niño in the October-November-December (OND) season, with CPC saying the event could “rank among the largest El Niño events in the historical record going back to 1950.”

NOAA CPC’s 3-month probabilities for El Niño (red), La Niña (blue), and ENSO-neutral (gray). The x-axis shows 3-month seasons from June-July-August (JJA) 2026 through February-March-April (FMA) 2027.

NOAA CPC’s 3-month ENSO strength probabilities for El Niño (red shades), La Niña (blue shades), and ENSO-neutral (gray). The x-axis shows 3-month seasons from June-July-August (JJA) 2026 through February-March-April (FMA) 2027.
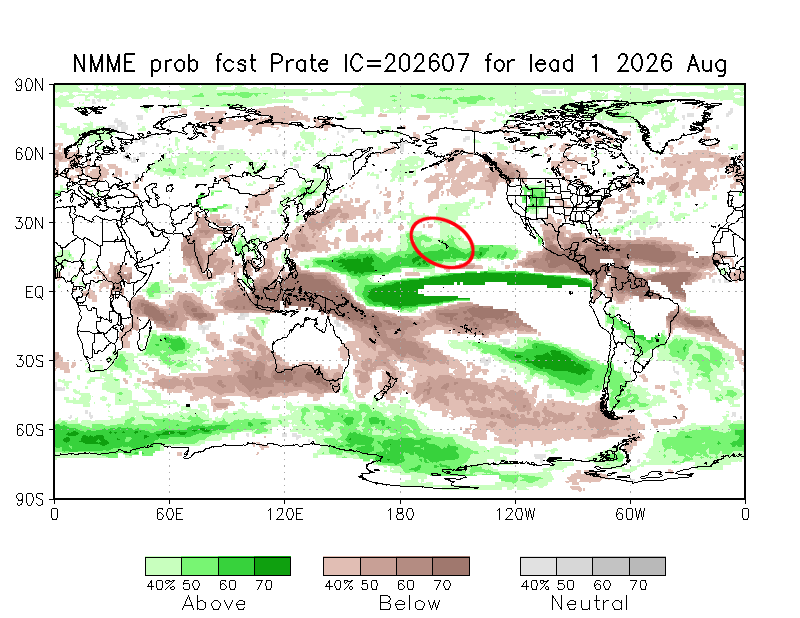
The strengthening El Niño will probably be the primary driver of rainfall conditions through the rest of the dry season and into early next year. The latest North American Multi-Model Ensemble (NMME), posted on July 8, shows probabilities favoring above normal rainfall through the rest of the dry season. After a transition month in October, a strong dry signal takes hold and intensifies into early 2027. The high probability for drier than normal conditions in the upcoming winter is expected during an El Niño, and especially for a very strong event. For me, the surprising part is how early the strong dry signal takes hold. I usually expect to see the dryness kick in during December and continue through February or March. The last time we had a very strong El Niño was in 2015. It helped produce the wettest dry season in 30 years and conditions remained fairly wet into mid-December before the El Niño dry pattern finally established itself. If the models are right, this year’s event could bring an earlier start to El Niño-related statewide drought conditions. Once established, these conditions will likely persist into the spring of 2027.
Initial impacts would likely be felt by the agriculture sector as pasture conditions start to deteriorate. Dry vegetation could also produce an uptick in out-of-season brush fires. Non-irrigated crops would also be impacted as well. Residents on catchment systems, even over the normally wet windward areas like the Big Island’s Puna District, could see supply shortages. As the dryness persists, water supply systems dependent on surface water sources could have shortages as flow from springs and streams diminish. These types of impacts have occurred in Hawaiʻi during previous El Niño events. We will have to see over the next several months how it all plays out.

Loop of monthly precipitation forecasts from the July 2026 run of the NMME (Kirtman el al., 2014). The loop covers the period from August 2026 through February 2027. Brown shades are areas where probabilities favor below normal precipitation. Green areas favor above normal precipitation. The red oval indicates the location of the Hawaiian Islands.
References
Kirtman, B.P., D. Min, J. Infanti, et al., 2014: The North American multimodel ensemble: Phase-1 seasonal-to-interannual prediction; Phase-2 toward developing intraseasonal prediction. Bull. Amer. Meteor. Soc., 95, 585-601.