
In last week’s post, I summarized the May through September 2026 dry season by calling it the “wet dry season of 2026.” The above average precipitation was, in part, due to the influence of a developing El Niño. What’s happening with this El Niño lately, and what will it do now that we’re in the wet season?
The latest El Niño Southern Oscillation (ENSO) probabilities from the National Oceanic and Atmospheric Administration’s (NOAA) Climate Prediction Center (CPC) show that the ongoing El Niño is highly likely to continue into the spring of 2027 (graph below). Based on the Relative Oceanic Niño Index (RONI) through September, the El Niño is at the “strong” level and is expected to peak in “very strong” territory later this fall (see intensity probabilities below). The last time we had an El Niño event this strong was in 2015-2016 (see RONI table below).

NOAA CPC’s 3-month probabilities for El Niño (red), La Niña (blue), and ENSO-neutral (gray). The x-axis shows 3-month seasons from September-October-November (SON) 2026 through May-June-July (MJJ) 2027.

NOAA CPC’s 3-month ENSO strength probabilities for El Niño (red shades), La Niña (blue shades), and ENSO-neutral (gray). The x-axis shows 3-month seasons from September-October-November 2026 (SON) through May-June-July 2027 (MJJ).

CPC’s RONI table values. RONI values in bold red font are El Niño events, bold blue values are La Niña events, and the remainder are ENSO-neutral. The x-axis shows 3-month seasons starting with December-January-February (DJF) on the left to November-December-January (NDJ) on the right. The table was split and cropped for easier viewing. I added the red shaded blocks to show the period when the 2015-2016 El Niño was at the “strong” and “very strong” levels. The yellow blocks show when RONI values reached the El Niño threshold. Note that it’s not in bold red font yet because RONI needs to be at or above 0.5C for five consecutive months before it’s designated as an El Niño event. This will happen at the end of October once the “ASO” value is determined.
That was CPC’s forecast, but CPC doesn’t have a monopoly on ENSO forecasts. What about predictions from other agencies? Yeah, pretty much the same story. As seen in the ENSO predictions “plume” diagram below, a very strong event is predicted by nearly all of the dynamical and statistical models.

Graph from the Columbia Climate School’s International Research Institute (IRI) showing the October 2026 model forecasts for SST anomalies in the Niño 3.4 region. Each line is a different climate model. Lines with filled icons are the dynamical models, and those with unfilled icons are statistical models. The dynamical consensus is the bold, dark red line, the statistical consensus is the bold, dark green line, and the combined average is the dark blue line.
And now, here’s the “so what?” portion. What usually happens in Hawaiʻi’s wet season during El Niño? Generally, the fall portion of the October through April wet season can still be rather rainy. In the 2015-2016 event, it was quite rainy in Hawaiʻi through mid-December. However, the winter and early spring portion of the wet season tends to be rather dry during El Niño, especially if it’s a moderate or greater intensity event. In the figure below, you can see that the January-February-March precipitation anomalies during a moderate or strong El Niño shows a large swath of below normal precipitation in the central and west Pacific.
In terms of weather patterns, you will often see the surface high pressure ridge shift southward from its usual position far north of the main Hawaiian Islands to a position near or over the state. This shift results in stable conditions with light winds and little rainfall. The shifted position of the ridge can remain in place for a while so the drop off in rainfall lasts a long time.
The southward shift in the high pressure ridge is caused by unusually strong low pressure systems in the far North Pacific. The strength and persistence of these strong lows produces an additional El Niño impact for the Hawaiian Islands…very large surf events along the north-facing shores. It’s not unusual during El Niño winters to have many High Surf Advisory and High Surf Warning events from north shore surf, especially in January.

Map of precipitation changes from the average across the tropical central and west Pacific during moderate and strong El Niño events. The image covers January through March in the year following El Niño onset and was pulled from Sutton et al. (2023).
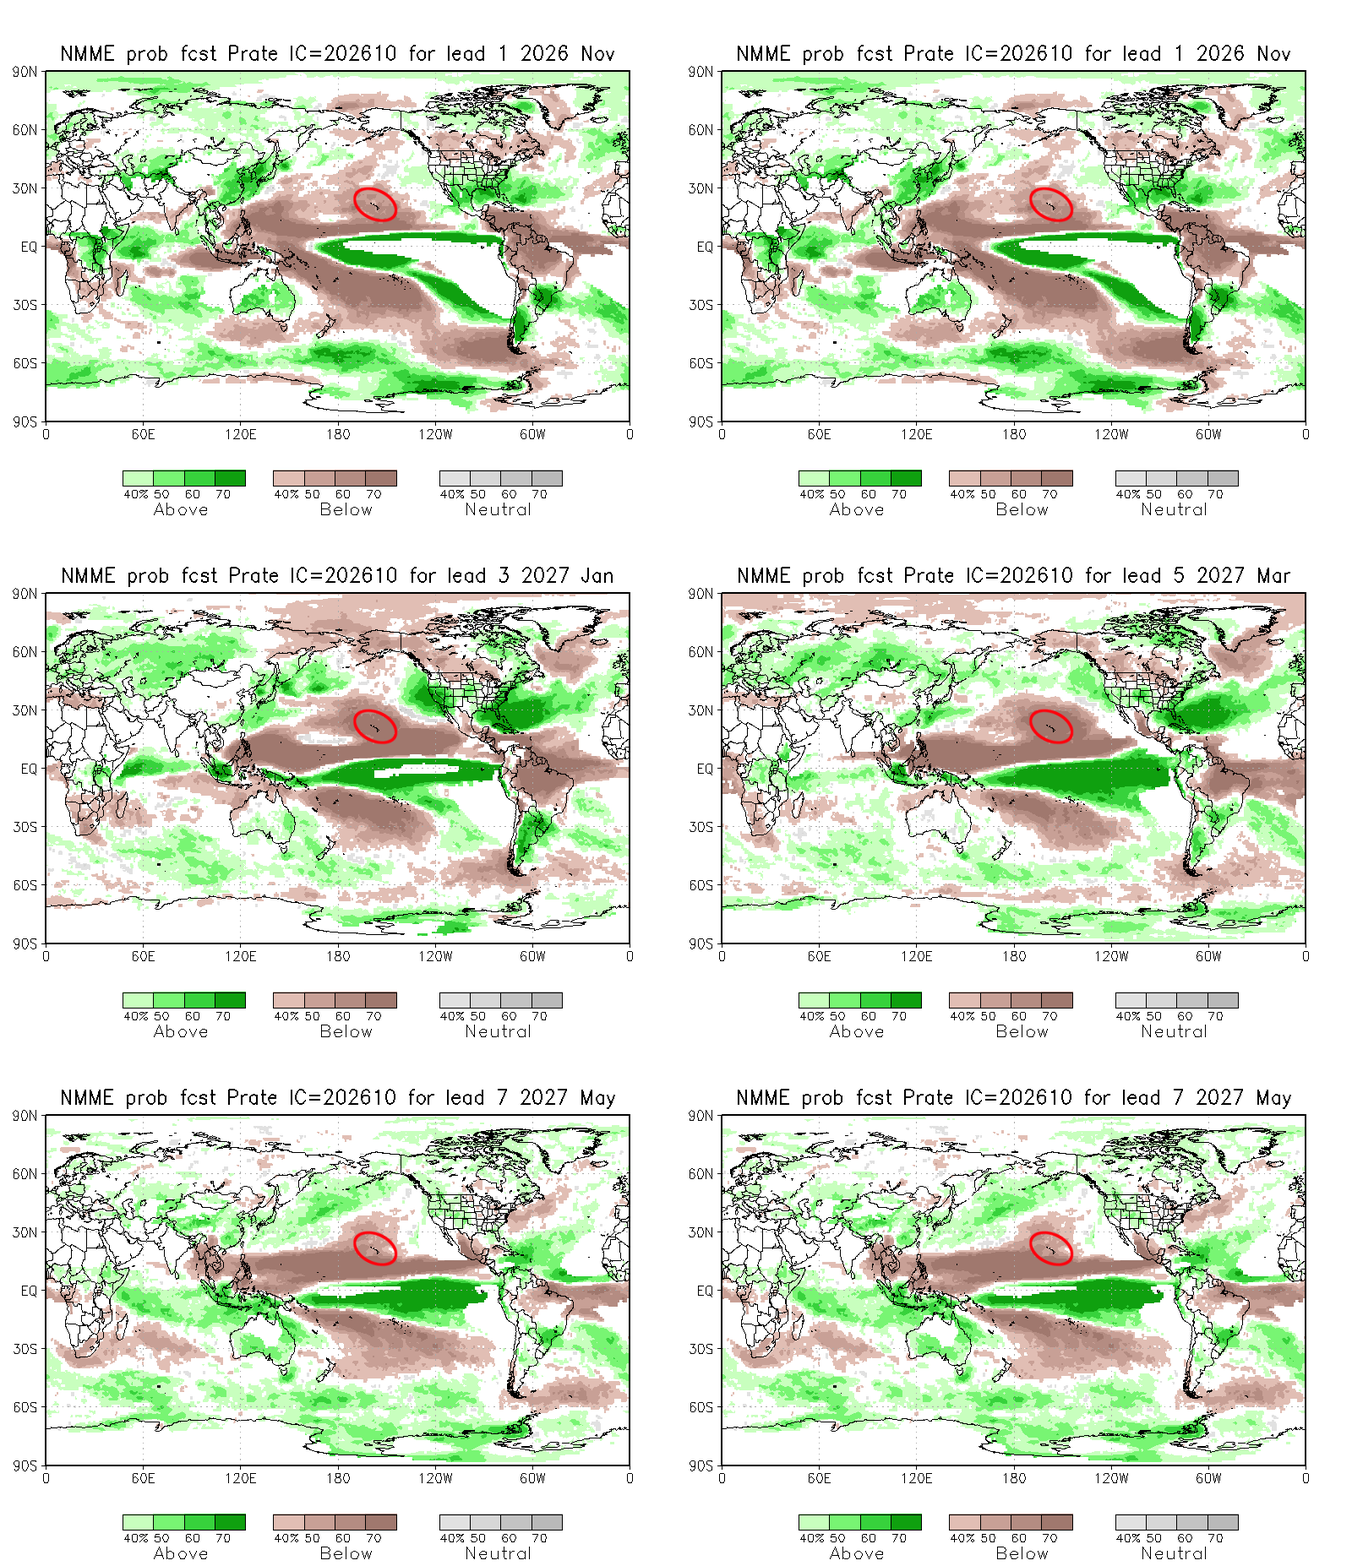
That’s what usually happens, but what do the models predict for the 2026-2027 El Niño? The latest North American Multi-Model Ensemble (NMME) output shows the Hawaiian Islands to be in an area with high probabilities for below normal precipitation (see loop below) from November 2026 through spring 2027. One thing that’s a bit unusual to me for the current event is how strong the dry signal is in November. During developing El Niño events, you typically see probabilities favoring dryness start to take hold in November, but not as strong and widespread as the NMME currently shows for this year.
CPC’s Long-Lead Hawaiian Islands Outlook, which utilizes NMME guidance, shows a 50 to 75 percent chance of below normal precipitation through spring 2027 across the state. The remaining probabilities are split between the near and above normal categories. For perspective, a 70 or 75 percent chance in any category in the long-lead outlook is rather unusual. You don’t typically see the odds tilt this far in any particular category in this particular outlook product.
A consequence of the reduction in rainfall, not surprisingly, is drought. According to the Media Advisory issued by the Honolulu Forecast Office on October 22, “sectors sensitive to short-term rainfall deficits are likely to have the earliest and most severe impacts.” This would include non-irrigated crops and pastures, water systems using surface water sources, and residents on rainfall catchment. The advisory also mentions that there’s a higher potential for “out of season” fires due to prolonged dryness and an abundance of fuels from heavy rain events earlier in 2026.

Precipitation probabilities for November 2026 through May 2027 from the North American Multi-Model Ensemble (NMME) October 2026 forecast. Brown shades are areas where probabilities favor below normal precipitation. Green areas favor above normal precipitation. The red oval indicates the location of the Hawaiian Islands.
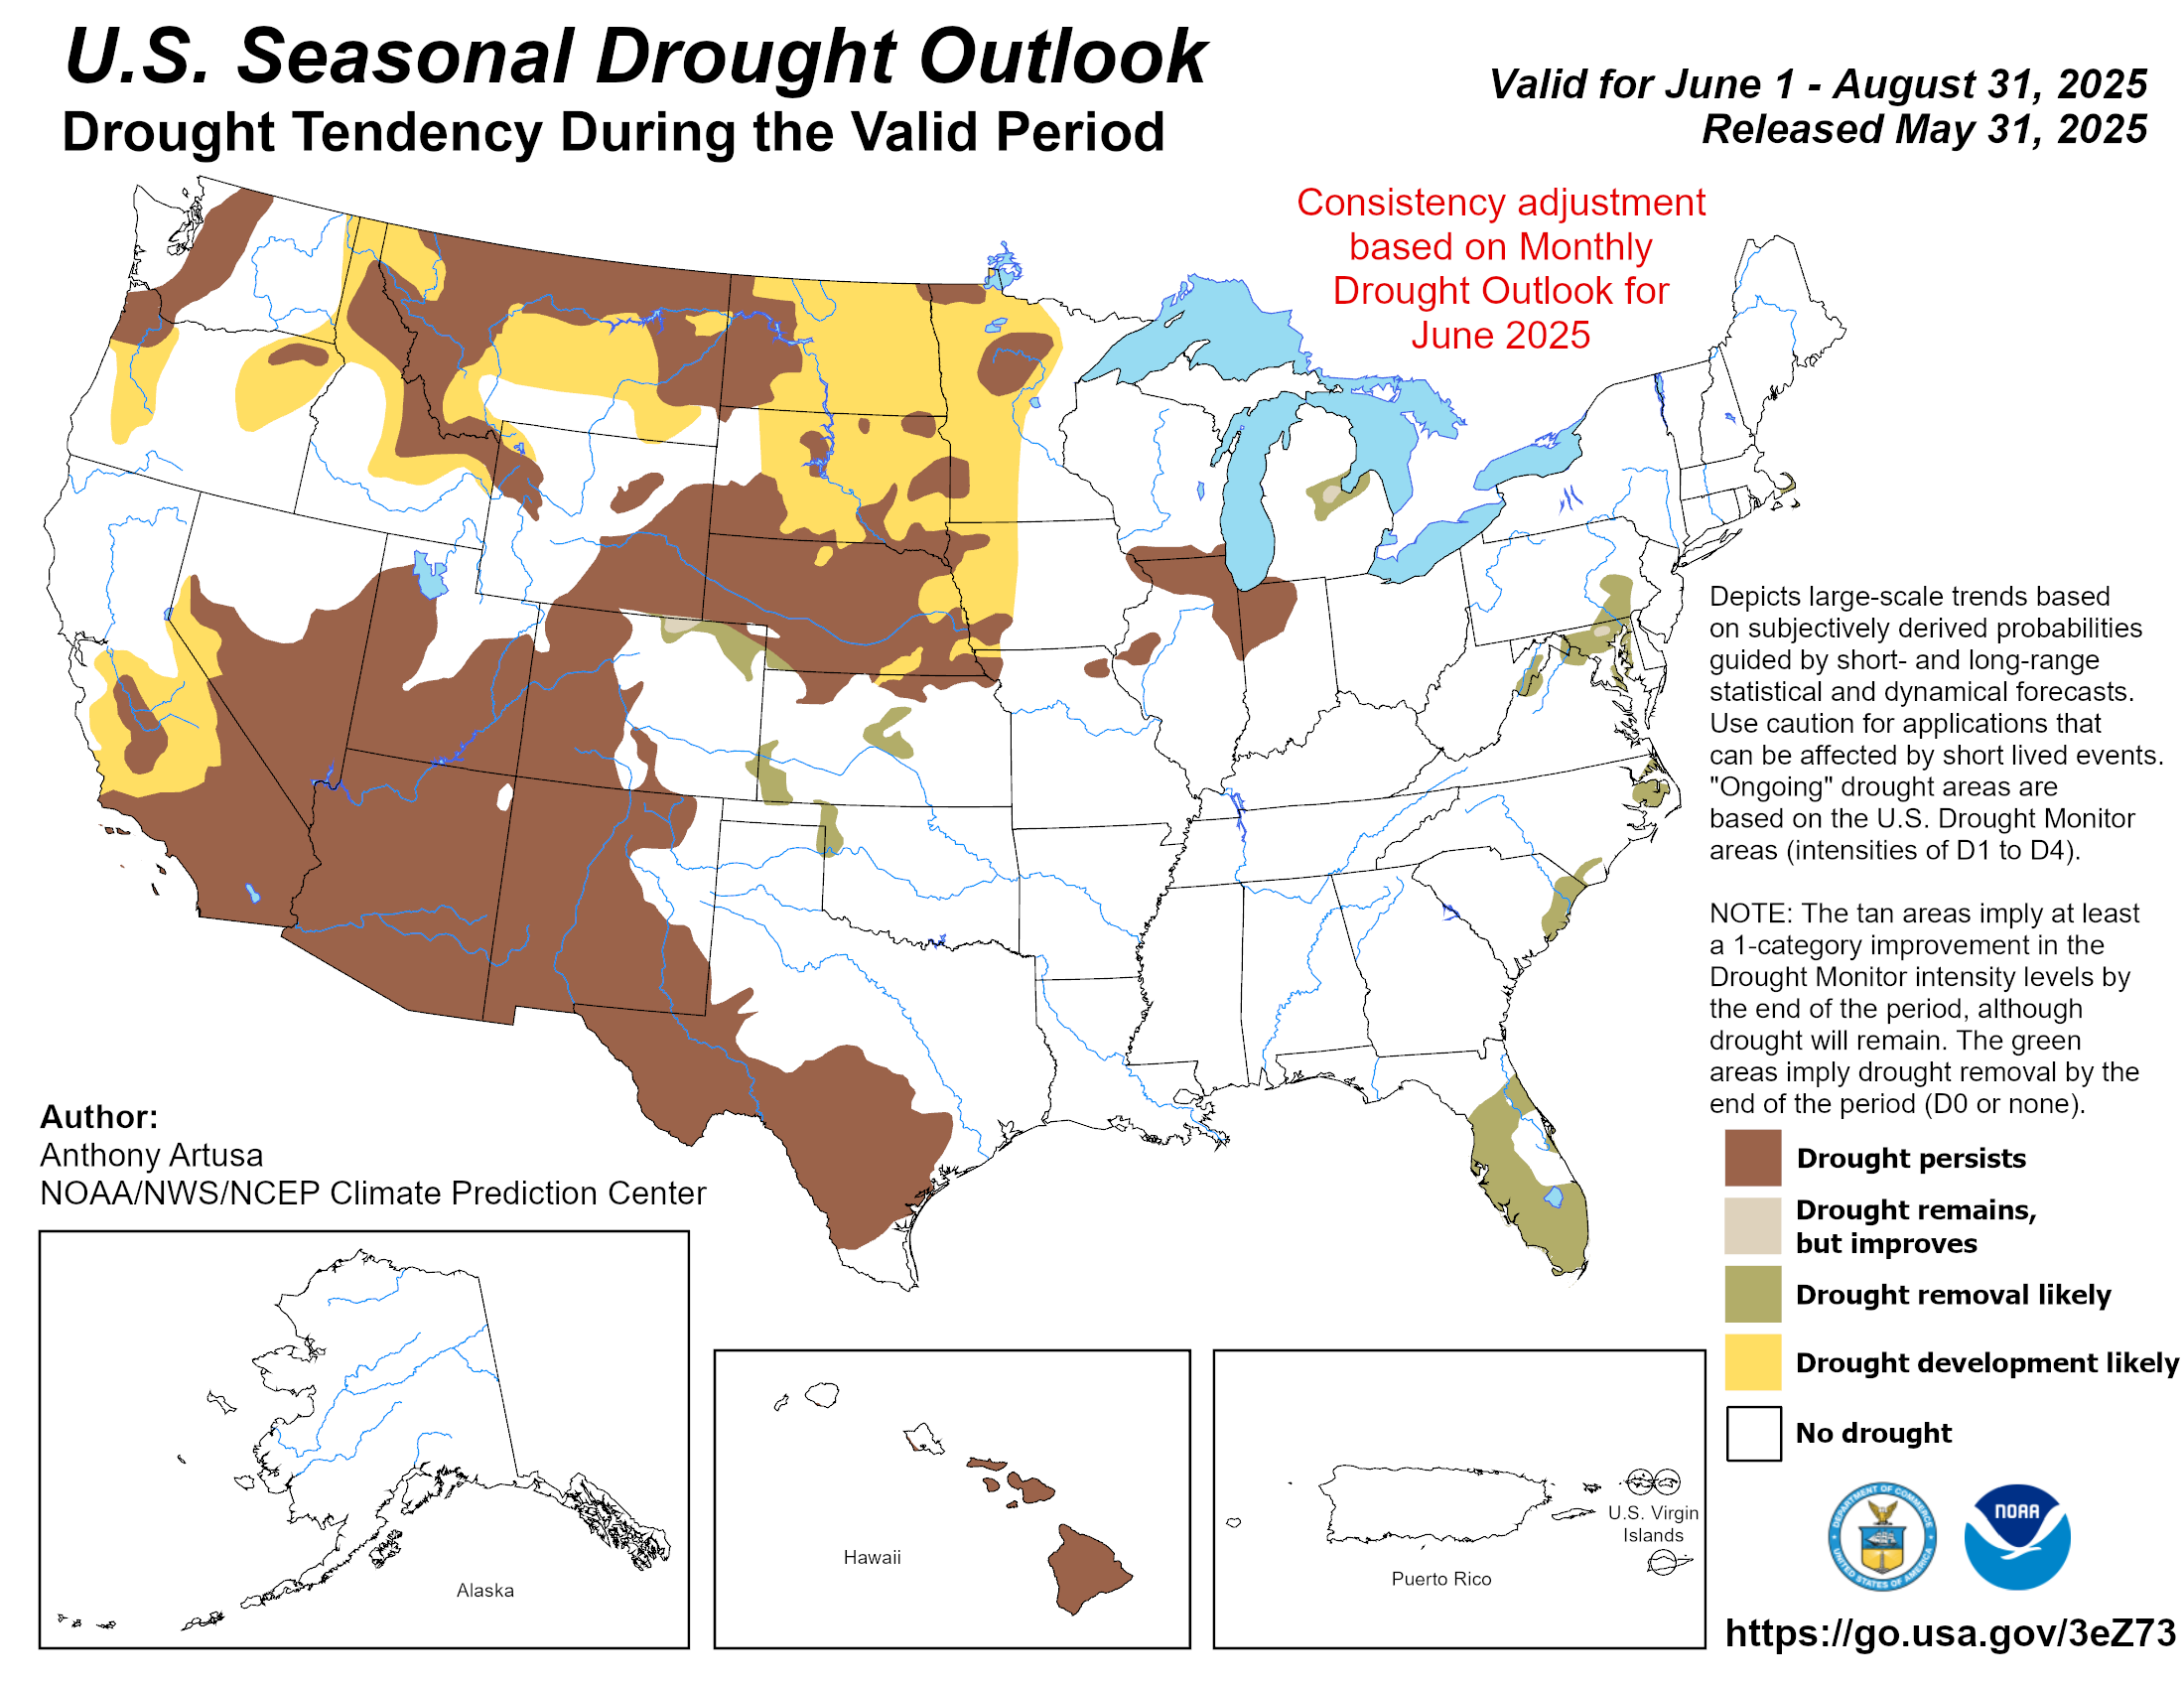
With the strong dry signal for the wet season, you would think that CPC’s U.S. Drought Outlook would show drought development over Hawaiʻi, but the latest outlook (below), valid from October 15, 2026 through January 31, 2027 doesn’t show any drought development areas. It’s quite the head-scratcher of an inconsistency, especially since their own long-lead outlook is leaning so strongly towards dryness.

CPC’s Seasonal Drought Outlook issued on October 15, 2026 and valid from October 15, 2026 through January 31, 2027. The Hawaiʻi portion of the outlook is at the bottom center of the figure.
As mentioned above, the last very strong El Niño was in 2015-2016. The U.S. Drought Monitor (USDM) maps below show that the Hawaiian Islands started the wet season with no drought due to the very wet summer and early fall conditions. In May 2016, after the end of the wet season, severe drought (D2 category) covered nearly 40% of the state, and there were a couple of small extreme drought (D3) areas over the leeward portions of the Big Island. We’ll see how the current El Niño plays out, and see what the USDM looks like next May.

U.S. Drought Monitor map for the main Hawaiian Islands for October 6, 2015. The D1-D4 categories are the different levels of drought. The D0 category, for abnormally dry conditions, can be considered as “pre-drought”.

Same as previous, but for May 3, 2016.
References
Kirtman, B.P., D. Min, J. Infanti, et al., 2014: The North American multimodel ensemble: Phase-1 seasonal-to-interannual prediction; Phase-2 toward developing intraseasonal prediction. Bull. Amer. Meteor. Soc., 95, 585-601.
Sutton, J., N. Luchetti, E. Wright, M.C. Kruk, and J.J. Marra, 2023. An El Niño Southern Oscillation (ENSO) based precipitation climatology for the United States Affiliated Pacific Islands (USAPI) using the PERSIANN climate data record (CDR). NOAA. https://www.ncei.noaa.gov/sites/g/files/anmtlf171/files/2023-08/ENSO_Rainfall_Atlas.pdf