My apologies, I published this blog post remotely and it appears that satellite imagery loops, which are the main content of this post, didn’t make through the process. I’ll have to publish it again once I have the issue resolved. Sorry for the inconvenience.
Programming note: Thanks for your interest in my maukashowers.com blog. I’ve been posting weekly for about three months now. Unfortunately I need to break that streak and won’t be able to do a post on November 7. I plan on posting again on November 14, barring unforeseen circumstances.
So far we’ve passed through the 2025 hurricane season without having a serious threat to any of the Hawaiian Islands. Hurricane Kiko got our attention for a while, but ended up passing north of the state without having any watches or warnings issued. We’re well past the peak of the season and have just about a month to go. Ten years ago it was a very different story. Enabled by an intensifying strong El Niño event, the Central Pacific basin (north of the equator, between 140 West longitude and the International Dateline) had 16 tropical cyclones for the 2015 season, shattering the previous record of 12 during the 1992 season. One tropical cyclone occurred in late December outside of the normal June through November season. There was also Hurricane Pali in January 2016, which I think should be counted as part of an extension of the 2015 season, but gets lumped in with the 2016 season’s total. The chart below shows the number of Central Pacific tropical cyclones by year, and 2015 just pops!

Number of tropical cyclones in the Central Pacific basin by year, from 1970 through 2024. The colors of the bars show the ENSO state during July-August-September (JAS), which is the peak period for tropical cyclone activity. Red indicates El Niño during JAS, blue is La Niña, and yellow is ENSO neutral (between El Niño and La Niña). The data are from the Central Pacific Hurricane Center (CPHC). ENSO state is based on the Oceanic Niño Index from the NOAA Climate Prediction Center.
A map of the 2015 season produced by the National Hurricane Center (NHC) is shown below. You can see the large number of systems that approached Hawaiʻi from the southeast and passed the islands to the north or south. There were also many systems that developed far southwest of the Hawaiian Islands. A keen observer may notice that the number of tropical cyclones listed in the table in the upper right is 17, but the bar graph above shows 16 for 2015. What gives?! The discrepancy is Tropical Depression 8-E, which is depicted as a remnant low crossing into the Central Pacific, but is not included in the CPHC’s total in the bar graph. If it was just a post tropical/remnant low, it would not normally be counted as a full blown tropical cyclone in the CPHC’s tally. I plan on asking CPHC about it and they can resolve it with NHC.

Map of the 2015 Central Pacific tropical cyclone season, produced by the National Hurricane Center. The numbers in boxes plotted on the map correspond to basin ID numbers. White boxes are for the starting point and black boxes are for the end point. There are numbers for the East Pacific and Central Pacific basins, so some are duplicated, such as “4” for Ela (EP) and Loke (CP).
The graphic below is something I created during my off time toward the end of the season back in 2015. It seemed to catch a lot of media attention after it was posted. I wanted to graphically show how lucky we were in the state to have so many tropical cyclones pass to the north and south of the islands. It was insanely busy for me and all the other hurricane forecasters at CPHC, especially during times when there was more than one tropical cyclone active in the basin. Many people, even within the National Weather Service, think that the Honolulu Forecast Office (HFO) and CPHC are two separate offices with their own staff members. The reality is that CPHC has zero staff and is activated from HFO personnel only when a tropical cyclone moves into or develops within the basin. As you can imagine, a season like the one in 2015 resulted in a lot of overtime and lots of consecutive 12-hour shifts in addition to the normal duties on the HFO side of the house. It was also a very wet summer, so in addition to the frequent CPHC activations, the HFO side had to augment shifts for hydrology operations to deal with flash flood events. On a personal note, the busy work load was complicated by having to care for my dog, Rufus, after getting off duty. He was diagnosed with cancer in July, went through treatments through most of August, then passed away on August 30. It was really difficult to work a 12-hour hurricane forecaster shift on the 30th, go home, take Rufus to the vet that night to be put down, then do another 12-hour shift the next day. Perhaps focusing on the hurricane forecasts helped take my mind off things, but it sure was tough!

Composite image of tropical cyclone activity in the Central Pacific during the 2015 season. The graphic consists of daily images of every tropical cyclone in the basin. The main Hawaiian Islands are shaded in blue in the center, so you can see how much activity missed the state to the north and south.
For the tenth anniversary of the 2015 tropical cyclone season, I thought it would be good to remember the activity in a different way other than a single track map or a composite graphic. The loops at the links below show infrared satellite images from GOES-15 for July through October. I separated the loops by month due to size considerations and loop length. Each loop has two images per day, from 0000 and 1200 UTC. Images are from the National Centers for Environmental Information’s (NCEI) GIBBS archive. I won’t spell out the GIBBS acronym, you can look it up at the link provided. I added annotations, including the names of the tropical cyclones as they appear. Only those systems that crossed into or developed within the Central Pacific basin are noted. I also stopped the annotations when the system went west of the Dateline. The center point of the image is near the equator and 135W longitude, so the CPHC area of responsibility starts a bit to the west of center. A couple of systems got west of 135W, but didn’t make it into the Central Pacific so they were not labeled. There were no tropical cyclones in November so there was obviously no reason to create a loop for that month. December only had a single tropical depression toward the end of the month so I didn’t create a loop for that one either.
I hope you find these loops interesting!
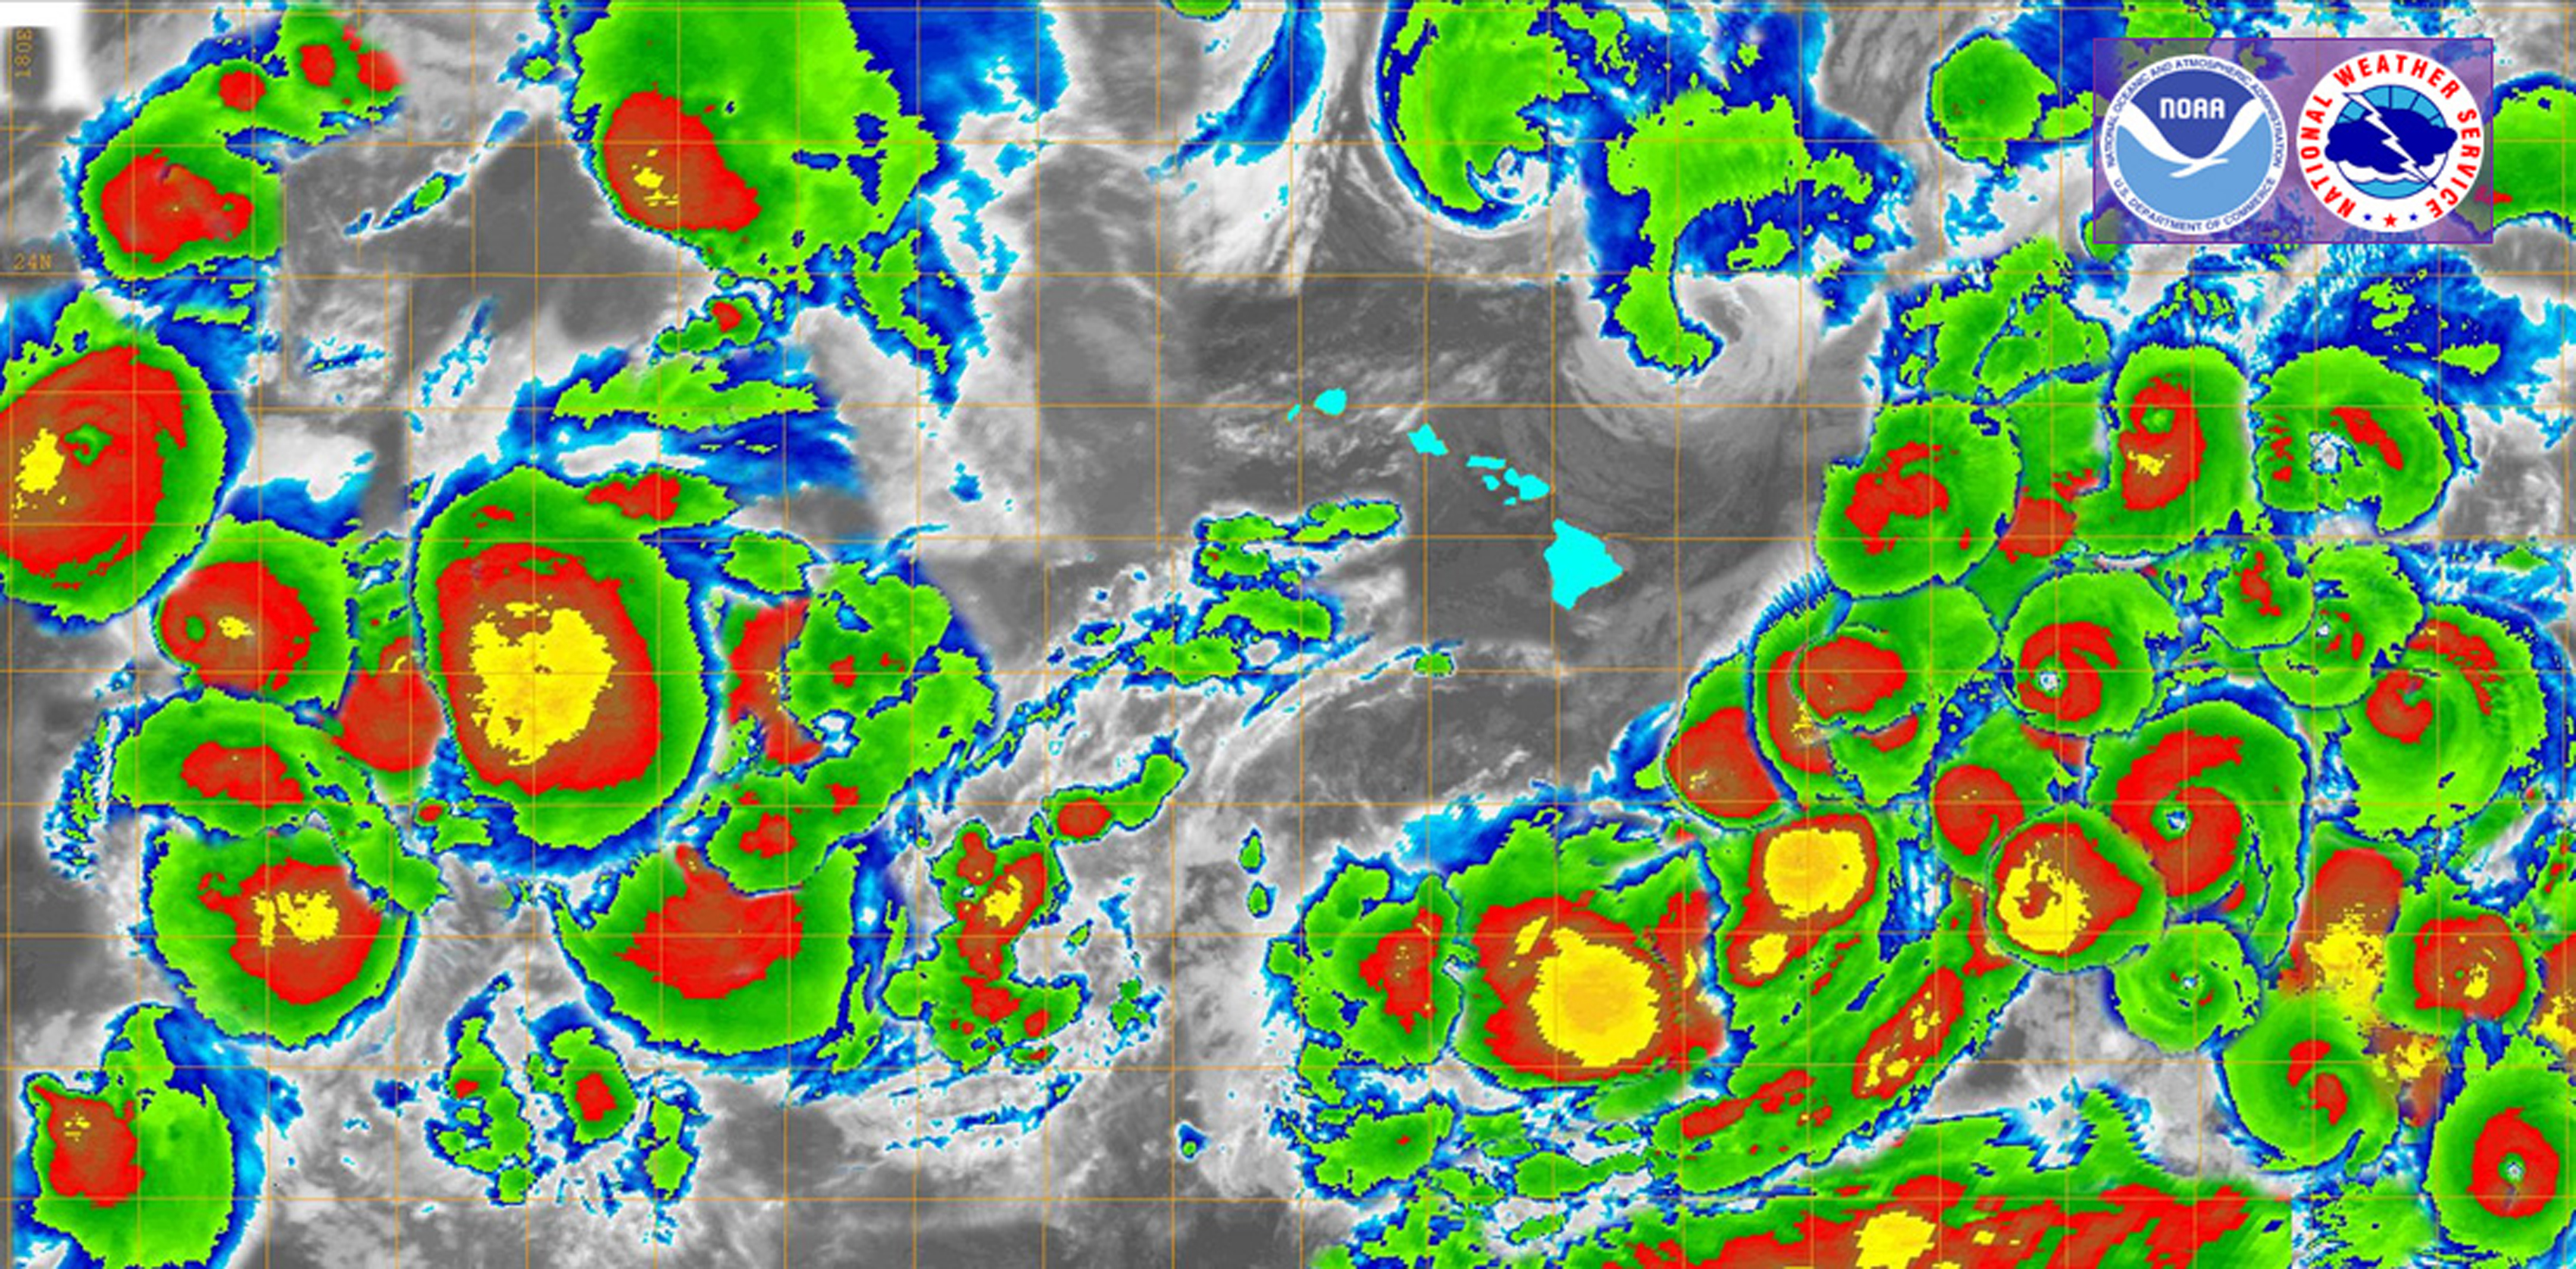
For reference, the image below shows the position of the main Hawaiian Islands in the full disk loops. It was not added to the loops to reduce clutter.

Links to monthly loops.
- Click here to view the loop of twice daily GOES-15 full disk infrared images for July 2015 from the NCEI GIBBS archive. I created the loop from still frames in the archive and added annotations for the tropical cyclone names.
One response to “The 10th Anniversary of that Crazy Hurricane Season of 2015”
[…] with some good news…I was able to resolve the issue with the unviewable satellite loops in the 2015 hurricane season post from a couple of weeks ago. The loops appeared fine in the draft, but I guess when I published it, […]