
The Holiday Season has come and gone, and we’re already halfway through January. I took down and put away my outdoor Christmas lights before the MLK holiday, which may be a personal best. But I’m not here to celebrate that achievement. I wanted to bring attention to the fact that we’re halfway through the October through April wet season! So how are we doing rainfall-wise?
Back in October, the National Weather Service (NWS) called for a wetter than normal wet season, mainly due to the presence of La Niña conditions in the tropical Pacific. The North American Multi-Model Ensemble (NMME) predicted that the wet season would have a slow start, with dry conditions in October. This would be followed by a transition month in November and wet conditions from December through spring 2026.
October ended up with below average rainfall over most areas of the state. Rainfall picked up a bit in the first half of November, and we had our first cold front passage of the wet season on November 8th. It was a little later than usual for the first cold front, but not crazy late. One notable aspect of October and November was the lack of any verified flash flood events. It’s hard to believe that in the not-so-distant past, November was the clear #1 and October was #2 in terms of flash flood frequency in Hawaiʻi. Now they are #5 and #7, respectively.
Then in December, we finally got our first significant weather event in the form of a cold front that stalled and dissipated after moving just east of Oʻahu. Its remnant moisture band shifted back westward and served as the axis for further bouts of rainfall over the west half of the state. While Kauaʻi and Oʻahu had a rather soggy week, the Big Island and Maui County missed out on significant rainfall, so by the end of December, the east half of the state did not really see a start to their wet season. It looks like the NMME was correct, but only for half of the state.
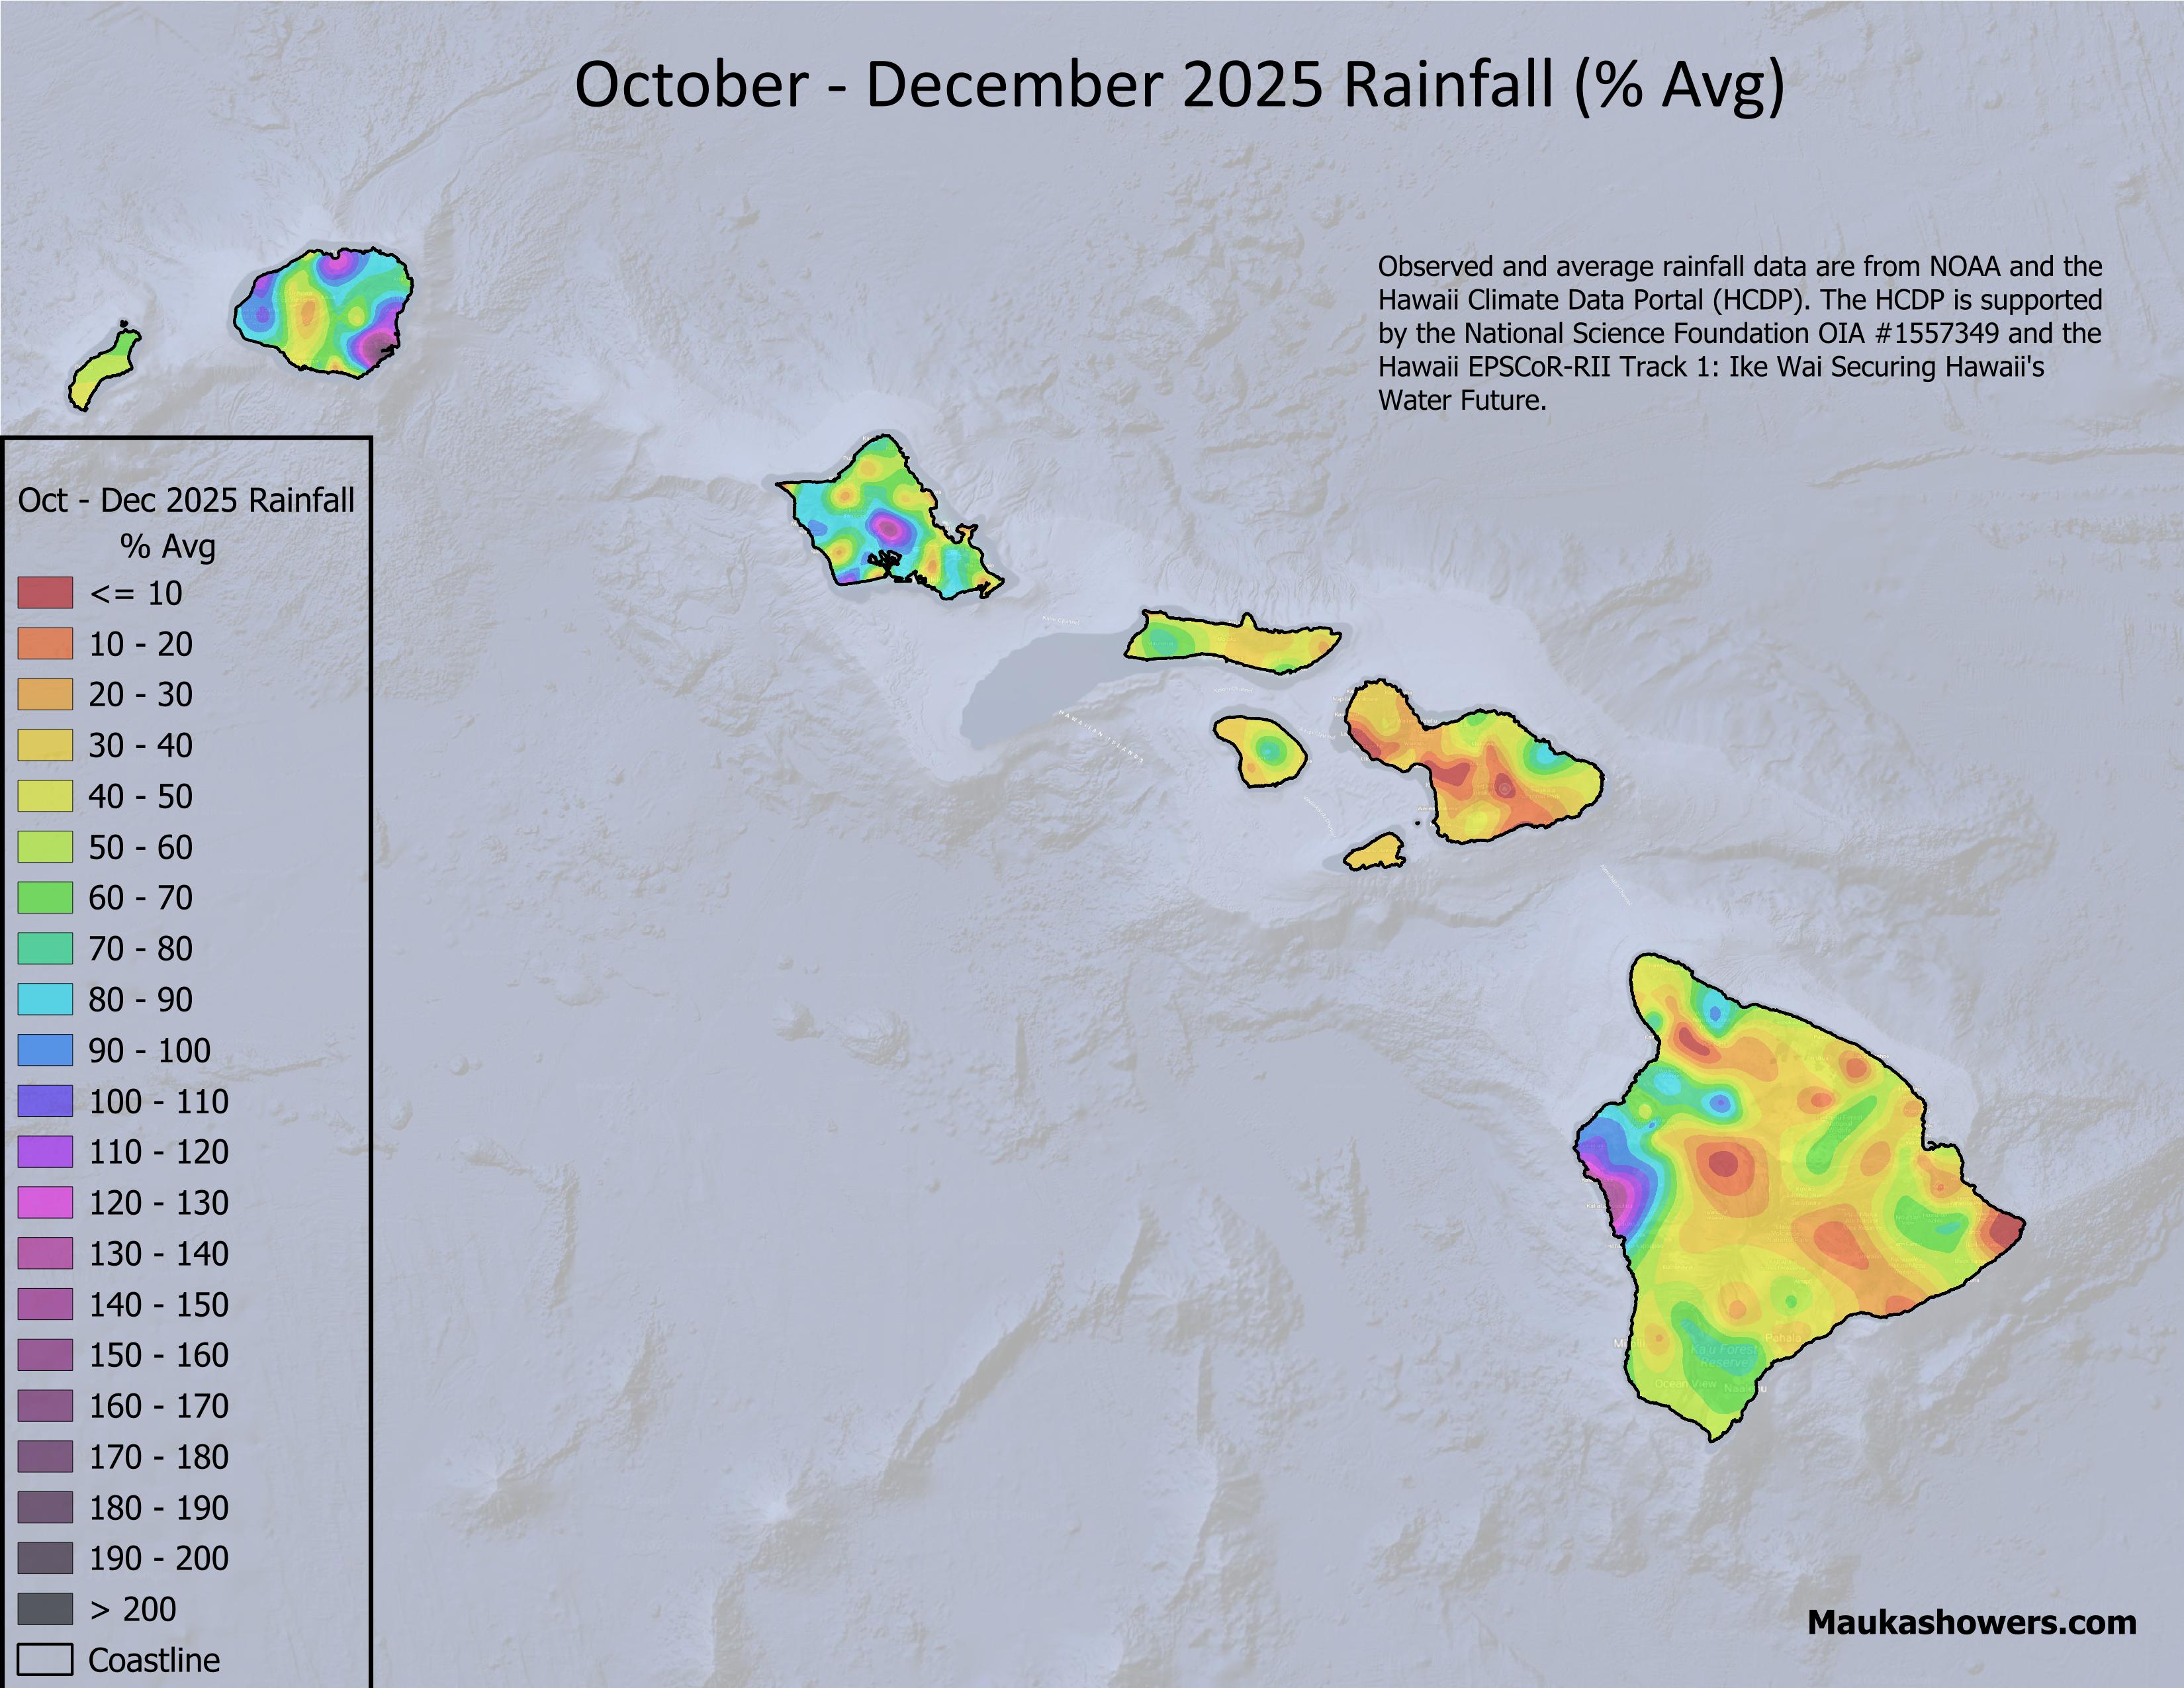
The map below shows the October through December rainfall in terms of percent of average. You can see most of Maui County and the Big Island covered in warm colors, which indicates that the total rainfall for the period is less than 50 percent of average. Kauaʻi and Oʻahu have more areas with near to above average totals.

Percent of average rainfall for October through December 2025 across the main Hawaiian Islands. Rainfall data are from the National Oceanic and Atmospheric Administration (NOAA) and the Hawaiʻi Climate Data Portal (HCDP). Average rainfall values were also from the HCDP.
Although the last three months of 2025 weren’t great for most of the Big Island and Maui County, at least January 2026 started out with better conditions. A small kona low managed to deliver significant rainfall to the southeast half of the Big Island to help ease drought concerns over that side of the island. I showed the graphic below in last week’s post but am repeating it here for reference purposes.

Map of gridded rainfall in inches for the 3-day period from January 4th through 6th, 2026. The data come from the HCDP daily rainfall data grids.
So what’s in store for the rest of the wet season? According to NOAA’s Climate Prediction Center (CPC), above normal precipitation is favored through the rest of the wet season (through April) and into the early portion of the May through September dry season. You can see the details in their latest outlook posted just yesterday (January 15).

Loop of monthly precipitation forecasts from the January 2026 run of the NMME (Kirtman et al., 2014). The loop covers the period from February through August 2026. Brown shades are areas where probabilities favor below normal precipitation. Green areas favor above normal precipitation. The red oval indicates the location of the Hawaiian Islands.

Same as the NMME loop above, but for the IMME. The IMME includes long range forecasts from the U.S., Canadian, and European forecast agencies, but only goes out to June 2026.
The CPC outlook and NMME/IMME guidance keep me hopeful that there will be more opportunities for significant rainfall over the next few months. As you can see in the latest U.S. Drought Monitor map (below), multiple events will be needed to ease stubborn drought conditions over the Big Island and Maui County.

U.S. Drought Monitor map for the main Hawaiian Islands as of January 13, 2026. The D1-D4 categories are the different levels of drought. The D0 category, for abnormally dry conditions, can be considered as “pre-drought”.
Oh, and by the way, this may be old news, but Hilo Airport did end up breaking the record for the lowest annual rainfall total. With only 59.05 inches recorded in all of 2025, it easily beat the previous record of 63.32 inches set in 2010. I figured I should mention this because I’ve been harping on it since the summer when I realized the record was in play. The Haywood plot for Hilo Airport is included below. Hilo Airport observations started in 1949, but the first full year of data was 1950.

Haywood graph of accumulated rainfall from January 1 through December 31 at Hilo Airport. The blue line shows the rainfall for 2025. Green-ish lines are the 5 wettest years and the yellow, orange-ish, and brown lines are the 5 driest years. The gray lines are the remaining years in the period of record going back to 1950. The bold black line is the average accumulated rainfall. The graph is from the NOAA National Centers for Environmental Information.
Reference
Kirtman, B.P., D. Min, J. Infanti, et al., 2014: The North American multimodel ensemble: Phase-1 seasonal-to-interannual prediction; Phase-2 toward developing intraseasonal prediction. Bull. Amer. Meteor. Soc., 95, 585-601.