
Anyone who remembers the late local comedian, Rap Reiplinger, will know the quote in the title from his “Room Service” skit. If you don’t know it, you can check it out on YouTube. When it comes to modern day rainfall collection efforts in Hawaiʻi, the process is, in fact, mostly “automation”. Just 20 years ago (yes, 20 years ago is recent for me!), most of the rainfall observations were from manually checked sites such as those in the National Weather Service’s (NWS) Cooperative Observer Program (COOP). Since then, the number of automated sites installed by various agencies and organizations has increased considerably while the number of manually recorded sites has decreased.
The map below shows automated, real-time rainfall sites across the main Hawaiian Islands based on a listing from the Hawaiʻi Climate Data Portal (HCDP). These sites not only provide the daily rainfall totals like the COOP network, but they also provide sub-daily scale observations. At some sites, you can view data down to 5-minute intervals. Note that the map does not include automated sites that are part of the Citizen Weather Observer Program (CWOP).

Map of automated, real-time rain gages across the state of Hawaiʻi. Site locations are based on a listing from the HCDP.
There are two main types of automated gages, those with real-time telemetry and those without. The type you have depends on the purpose of the site. In most cases, a group with funding to install a network of automated rain gages also needs to see the data in real-time and will also purchase the needed hardware to transmit the data. However, some users, such as researchers conducting a watershed study, just want to record high quality data without the requirement to see the observations in real-time. In this case, the researcher would save money on the communications gear and send field crews to download data from the sites as needed.
The rain gages at these automated sites come in a variety of flavors. Of the sites that I’m familiar with, all are either tipping bucket gages or weighing gages, with tipping buckets being the more popular of the two. The inside of a tipping bucket gage looks like a seesaw with a small collector “bucket” on each side. When water from the collection funnel pours into the gage, it fills one of the buckets. When the bucket is full, it tips so that the bucket on the opposite sides starts to fill. During the tipping process, a magnetic switch is tripped and sends a signal to the data logger which tallies up the number of tips. Each tip represents 0.01 inches. The data logger adds up the number of tips over programmed time intervals to give you a rainfall accumulation. A picture of the tipping bucket mechanism is shown below.

Tipping bucket gage mechanism that is housed within an outer cylindrical enclosure. An outer collection funnel at the top of the enclosure drains water into the collection funnel shown here. The rubber band is attached to secure the tipping bucket during transit and is not part of the operational installation.
A weighing gage does just that. It weighs the amount of water that collects in a large bucket and the change in water weight over time is converted to give you the accumulated rainfall total. It’s not used as widely as the tipping buckets, but can be found in the Automated Surface Observing System (ASOS) at many airports and Fischer-Porter rain gages at some of the NWS COOP sites. ASOS rainfall data are sent in real-time within coded weather data messages. Fischer-Porter sites are not equipped with communications gear and the data are stored on digital data cards that must be retrieved periodically. A Fischer-Porter weighing gage is shown below and is bigger than tipping bucket gage because of the size of the rainfall collector.

The white enclosure is a Fischer-Porter rain gage. The collection bucket, weighing mechanism, and data logger are all housed within this enclosure. The diameter of the opening at the top is eight inches.
There are other more exotic types of gages, such as acoustic and ultrasonic sensors. I’ve heard anecdotally that these types of gages are accurate, but tend to be more expensive and more difficult to maintain. I’m not aware of any of these types of rain gages in Hawaiʻi.
In addition to the actual rain gage, real-time reporting units must also have communications gear, which can come in a wide range of flavors. A receiving site must also be available to handle incoming data transmissions and to process, store, and forward the rainfall data in a form that end-users can handle.
One of the popular data telemetry methods, especially for government-run rain gage networks, is to use the GOES (Geostationary Operational Environmental Satellite) system. Yes, this is the same satellite that captures and sends weather imagery and sounder data. An important additional function of the satellite is to receive data messages sent by field sites and forward them to downlink sites for processing and distribution to end-users. A majority of the real-time rain gages operated by the Honolulu Forecast Office (HFO) use GOES for data collection and distribution. All fire weather and climate monitoring RAWS (Remote Automatic Weather Station) sites and many U.S. Geological Survey (USGS) sites also use GOES for hydrological and meteorological data delivery. The picture below shows one of HFO’s automated rain gages using GOES telemetry. For authorized users of the GOES data delivery system, it’s a very reliable and free service.
The image below shows an example of an automated rain gage using GOES for data transmissions. An operator can configure their site in any way that suits their needs, but it must have a line-of-sight radio path to the orbiting satellite. In Hawaiʻi, we point the antenna roughly to the southeast at an angle of about 55 degrees above horizontal. Transmissions are routinely sent at the same time every hour on an assigned channel, and more frequently on a special channel if intense rainfall is observed.

Example of an automated rain gage that uses GOES for data delivery. The directional Yagi antenna points toward the satellite. The site is self-contained and uses batteries charged by solar panels for power.
Another popular telemetry method for automated rain gages is VHF or UHF radio using the ALERT and ALERT2 standard. Among the nice features of these types of rain gage networks is that when the tipping bucket registers rainfall, a transmission is sent immediately so there is very little data latency. The radio frequency band is also reserved for ALERT/ALERT2, and once you have your sites installed, the transmissions are free. One down-side is that you need a line-of-sight radio path, which is fine in a flat area but harder in mountainous terrain (like Hawaiʻi). When you don’t have a valid radio path, you need to have a repeater installed to relay transmissions, usually up on a mountaintop or ridgeline. These repeaters can collect data from several sites and relay the transmissions to base stations for collection and processing.

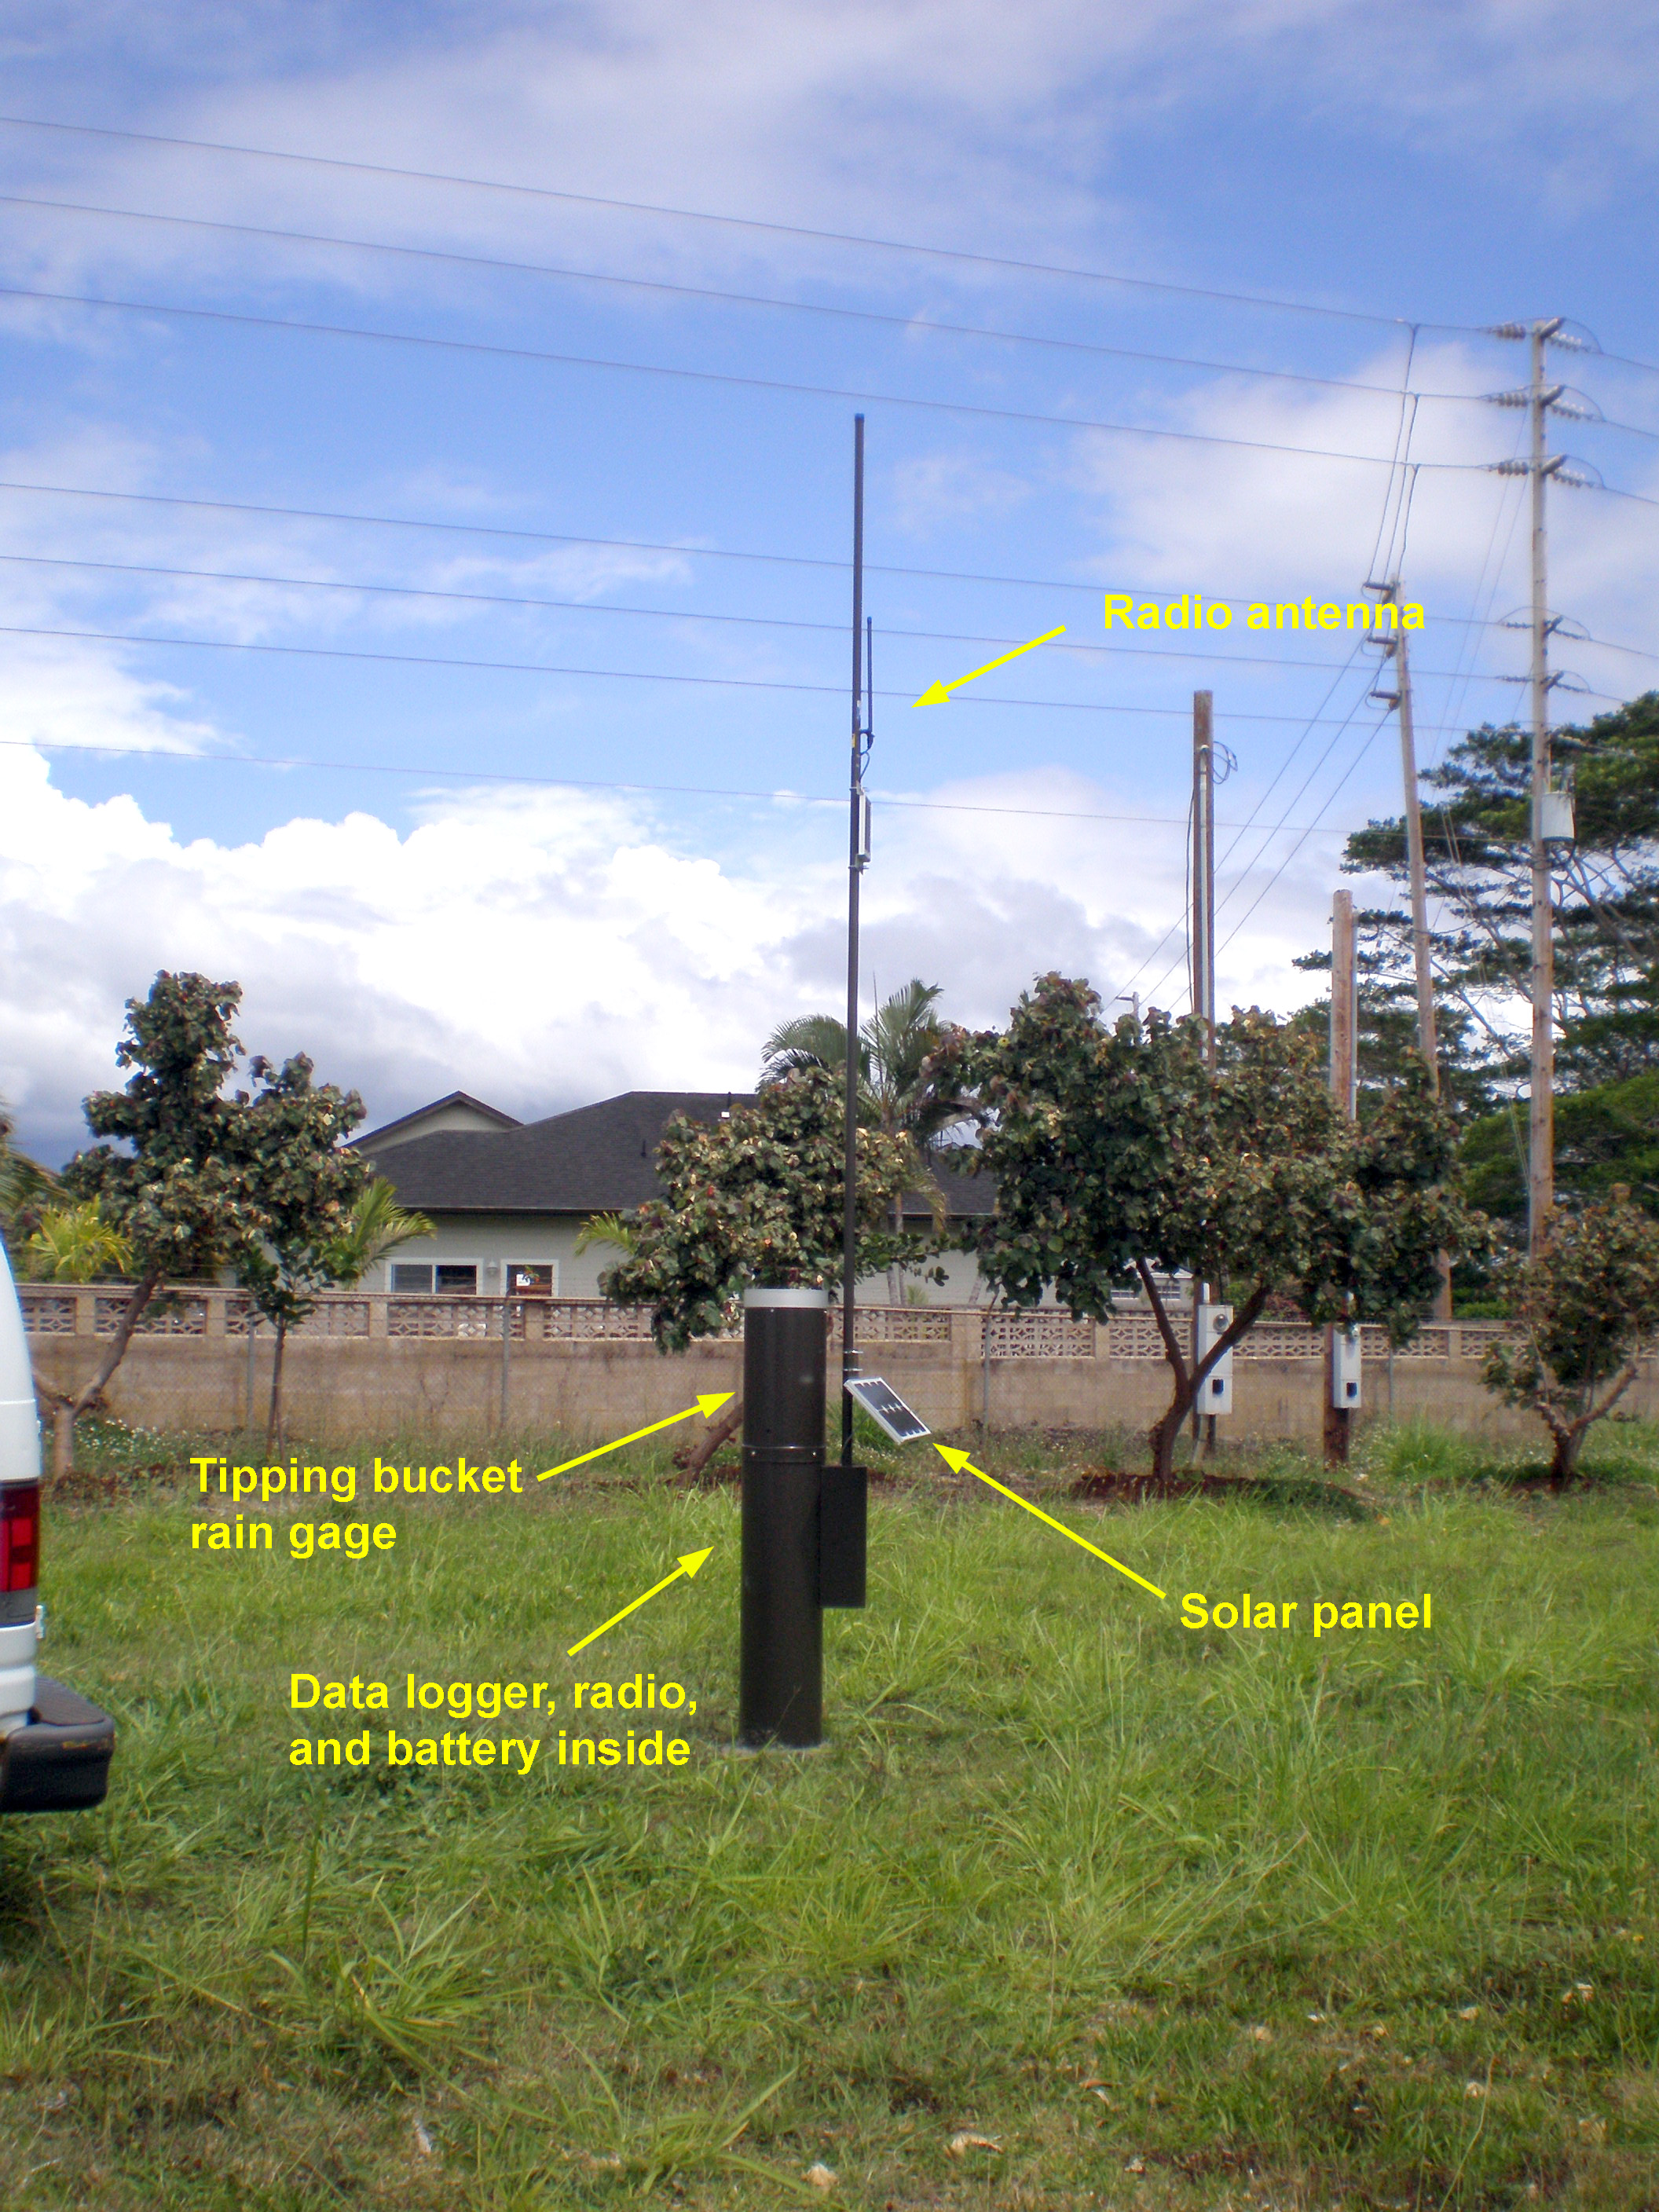
This is an example of an ALERT/ALERT2 type of rain gage. These sites are often installed using a 12-inch diameter aluminum standpipe with the tipping bucket on the top and the data logger, batteries, and transmitter stored inside below the gage. The transmitter antenna and solar panel are mounted outside. Like the GOES sites, these gages are self-contained, using only batteries charged by a solar panel. Power consumption on a standard installation is quite low so the site can still function even without solar power for quite a while.
The last type of automated rain gage I wanted to cover uses telephone service to transmit data. Unless you’ve lived on a deserted tropical island for many years with only a volleyball as your friend, you know that there are different types of phone service available, and these can all be used to send rainfall data to end-users.
At the Honolulu Forecast Office (HFO), the original fully automated rain gage network, called Hydronet, used standard commercial telephone lines for data transmissions. This communications set-up was generally reliable compared to other methods available at the time (more than 30 years ago). However, like your home phone, we had to pay a phone bill for every line every month, which adds up to quite a bit when you have over 60 sites across the state. Another disadvantage is that your sites are limited to the phone line tether, making it very difficult to place gages in areas you really want to observe. How many phone lines are up on the top of Waiʻaleʻale? Try zero.
Within the last 20 to 30 years, commercially available wireless phone options allow agencies to place gages in more remote areas. Cellular phone modems are a popular option used in Hawaiʻi by some groups such as the USGS and the Hawaiʻi Mesonet. These sites are also generally reliable, and not limited to landline availability, but the site still needs to be within range of a cellular tower so siting options are not unlimited. There is also the monthly bill to think about since cellular service is not free!
If you really need to have a rain gage located in a particular spot and you’re out of cellular service range and don’t have a line-of-sight path to GOES (e.g. in a deep valley), then using the Iridium satellite phone service may be your best option. The Iridium network uses a large number of satellites in polar orbit so your data transmission can usually be sent immediately or within a few minutes. In most cases, data latency is within operationally acceptable limits, even for flash flood applications. A big downside for Iridium-based networks is cost. You’re paying for each data message so if you have a large number of gages in your network, it can be a budget buster.
Back in my November 21 post, I talked about how it is difficult to beat the accuracy of a diligent observer of rainfall. If that’s the case, why use automated gages at all, especially when the devices and data transmissions can be pricey? Here are some of the advantages that automated sites provide.
- Near immediate availability to operations: This is particularly important in areas such as Hawaiʻi where flash flooding is a primary concern. Data can be analyzed in real-time with other data sets to assess threats and provide sufficient lead time for useful warnings.
- Availability of data on a sub-daily time scale: Nearly all automated sites provide at least hourly rainfall data, and many also have sub-hourly totals, usually 15-minute or even 5-minute intervals. This is also useful for flash flooding situations. Rainfall data from manually recorded sites are mostly provided once per day.
- Consistent time of observations: Data from automated sites often use synchronized time, some at the data logger by Global Positioning Satellite (GPS) clocks or at the computer workstation processing the data. This allows end-users to obtain a more accurate snapshot of conditions at a specific time from a range of data sources. Manual observations are often taken at 7:00 AM, or 8:00 AM, or 6:35 AM, or at 6:20 AM but written down as 7:00 AM, or…you get the picture.
- Ability to place rain gages in remote areas: An automated site can be placed just about anywhere you need data as long as you can safety get to the site. An important consideration is not just access for the initial placement, but the ease in which you can get to the site for maintenance. I suppose some people are willing to live on a remote mountaintop and do nothing but measure rainfall, but I doubt they would be able to do it 365/7. And can you find 50 of them for your entire network? Probably not.
- Available for radar bias adjustment: Systems such as NOAA’s Multi-Radar, Multi-Sensor (MRMS) use real-time rainfall data to correct biases in the radar-only estimates of precipitation. The figures below show a radar-only estimate (upper figure) of rainfall for the South Hilo and Puna Districts of the Big Island, and the MRMS Pass 2 estimate (lower figure) that uses automated rain gage data to correct the biases in the radar data. The inclusion of rain gage data in the Pass 2 estimate increases the rainfall totals over the Hilo and Puna areas that are systematically underestimated by the radar due to terrain blockage of the lower elevation radar scans. While manually recorded data can also be used for this purpose, you’re limited to correcting just the daily totals, and the lack of time synchronized data introduces more errors to the result.


Maps of precipitation estimates from the MRMS system covering the 48-hour period ending at midnight HST, February 27, 2021. The estimates in the upper map are from radar data only. The lower map includes rain gage data to correct biases in the radar-only estimates.
There are other advantages, but I think I’ve hit the main ones. Naturally, there is no perfect system, and it’s only fair to list some of the disadvantages of automated rain gage networks when compared to manually observed sites.
- Cost: A reliable and accurate automated rain gage is expensive. It’s not just the data logger, transmitter, and rain gage, but the site hardware and enclosure. A sturdy pad and weather-resistant enclosure can be almost as expensive as the rain gage itself. Then there’s the ongoing maintenance requirements. Components fail, calibrations drift, systems become obsolete. Then there’s the time and travel requirements for your technicians, and the cost to train them to maintain the sites. A rough rule of thumb is to budget 10 to 15 percent of your initial installation cost for your annual recurring maintenance needs. How are you getting the data? Do you have to pay a provider to host all your rainfall observations online? It’s not cheap to run an automated rain gage network!
- Bias: Most automated sites use tipping buckets for recording rainfall. This type of gage will underestimate totals during intense rainfall due to losses as the buckets tip back and forth. The higher the rainfall intensity, the larger the error. There are some clever compensating mechanisms that increase accuracy, but that increases the price of the gage. Wind also results in underestimates of rainfall. The stronger the wind, the greater the underestimate. In all fairness, this affects manually observed rainfall data too.
I could go on quite a bit more with a lot of details, but I think I’ve provided enough to give you a picture of the variety of real-time rain gages available, and the pros/cons in using these types of sites. I also hope this post gives you a level of appreciation for how much it takes to get the rainfall data you see in the media and in presentations and publications, much of which are freely available to the public.