
If you’ve lived in Hawaiʻi for any amount of time, you quickly get used to the trade winds, coming from the northeasterly to easterly directions, being present most of the time. It’s so ubiquitous the geographic areas on the east sides of the islands are referred to as “windward” regardless of the actual wind direction. The table below shows the prevailing wind direction at the four main airports across the state that also serve as primary climate monitoring sites.
| Līhuʻe | Honolulu | Kahului | Hilo | |
| Direction | northeast | east-northeast | northeast | west-southwest |
Listing of prevailing wind directions at the 4 main airports across the state. The data are from the Western Region Climate Center (WRCC) Hawaiʻi and Pacific Climate Data Summaries.
Not surprisingly, the most common wind direction at the Līhuʻe, Honolulu, and Kahului airports is from the northeast or east-northeast. But what’s up with the “west-southwest” at Hilo Airport?! In fact, when you look at the prevailing wind direction (table below) at Hilo Airport for every month, they’re all either from the southwest or the west-southwest, even during the summer when you have 90% of the days with large scale trade winds affecting the state! What’s going on?

Screenshot of the winds section of the climate data summary for Hilo Airport from the WRCC link above.
In addition to the averages, we can also look at some of the observational data from a sampling of days. The plot below shows three days of wind direction and speed data at Hilo Airport. The yellow band highlights the directions from south to west. The downslope direction is southwest to west-southwest. Notice how the green 5-minute wind direction points swing around to the downslope direction in the early evening and mostly remain there until after sunrise the next morning. This happens on most nights through the year.

3-Day plot of Hilo Airport 5-minute wind speed (blue) and direction (green) data from the National Weather Service Weather and Hazard Data Viewer. The yellow band of directions from south to west highlights the downslope winds at the airport during the nighttime hours.
One of the reasons this persistent southwest to west-southwest wind occurs over Hilo is because the Big Island is, well, BIG. The trade winds are unable to go over the island and most of the air is forced to go around it. It’s like a big rock in a stream. As a result, the trade winds are usually blocked over Hilo, allowing the nighttime combined land breeze and downslope (“katabatic”) flow to become established. Several studies have documented this, such as Chen and Nash (1994).
Another reason is that the downslope winds will also occur during other large scale patterns that can periodically replace trade wind conditions. This includes light wind patterns when the large scale surface pressure gradient is weak, such as when a ridge of high pressure is near or over the state. It also includes kona wind patterns if the large scale winds are from the west or southwest.
There are some large scale patterns that will produce winds that overcome or highly modify the downslope flow over Hilo. These include north or north-northwest winds that occur following some types of cold front passages. Large scale south or southeast winds will also do the trick. This low level wind flow direction can occur when a low pressure system is to the west or northwest of the Big Island.
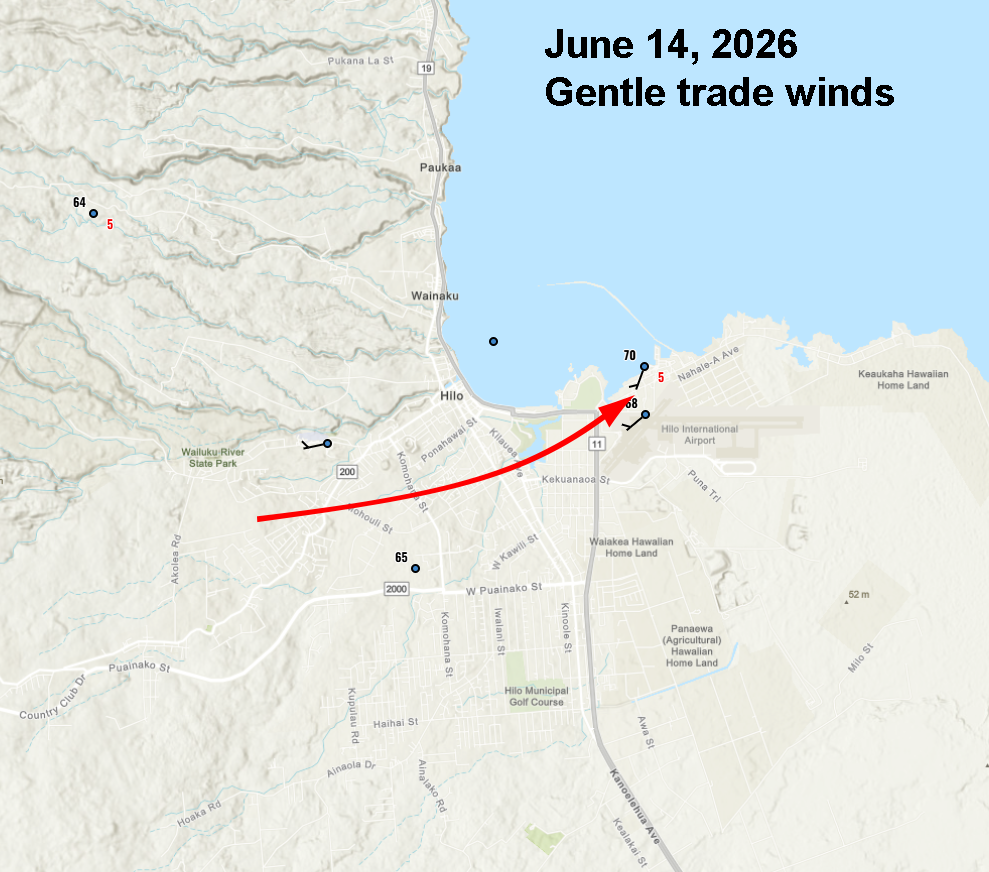
The maps below show examples of nighttime wind observations (either 2:00 or 3:00 AM HST) in the Hilo area during various large scale weather patterns. There are several data sites in the Hilo area, but it’s mainly the Hilo Airport, Hilo Harbor, and Hawaiʻi Mesonet’s Piʻihonua sites that have wind data. Three of the five maps show winds at Hilo Airport from a downslope direction. The other two were provided to show examples of patterns that don’t produce the usual downslope winds.

Plot of observations in the Hilo area at 2 AM HST, January 25, 2026 from the observations archive on the National Weather Service Weather and Hazard Data Viewer. The red arrow was added to highlight the general direction of the near surface wind flow. This was a period with light large scale winds due to a ridge of high pressure just north of the state.

Same as previous, but for 2 AM HST, February 4, 2026. A cold front moved east of the Big Island, resulting in post-frontal north-northwest winds over the east half of the state.

Same as previous, but for 3 AM HST, February 10, 2026. On this date, there were strong trade winds across the state, and even gale force trade winds just north of the island chain.

Same as previous, but for 2 AM HST, March 14, 2026. A large kona low northwest of the state resulted in large scale southeast winds over the Big Island.

Same as previous, but for 2 AM HST, June 14, 2026. Pretty typical trade wind pattern with gentle large scale winds from the east-northeast.
The layer of downslope winds is fairly shallow, and balloon sounding data from Hilo Airport usually shows southwest or west-southwest winds only in the lowest one or two wind barbs. The example skew-t plot below shows just the near surface wind barb at a southwesterly wind direction. The high resolution sounding data shows that the downslope flow layer was around 400 meters (1312 feet) deep for this instance.

Plot of data from the Hilo Airport balloon sounding at 2 AM HST, July 12, 2026. Vertical bold black lines are temperature (right) and dew point (left). Wind barbs at various levels are plotted on the right. The red box was added to highlight the lowest layer winds. Plot downloaded from the Univ. of Wyoming Atmospheric Science Radiosonde Archive.
While growing up in Hilo, I was pretty familiar with the cool nighttime breezes “from mauka side”. However, it wasn’t until one of my UH professors told me in graduate school that I found out the west-southwesterly nighttime breeze was the dominant wind direction in Hilo. It might be one of those trick questions that you can use on your next trivia night!
Reference
Chen, Y.-L., and A. J. Nash, 1994: Diurnal Variation of Surface Airflow and Rainfall Frequencies on the Island of Hawaiʻi. Mon. Wea. Rev., 122, 34-56.