
In my January 30 post, I talked about how our October through April wet seasons (hoʻoilo) have been starting out slower in recent years. October and November used to have, by far, the highest number of flash floods, but that is no longer the case. In 2020, March became the month with the highest flash flood frequency, with December now clearly #2. November has slipped to #5, and October is tied with September at #7.
Seeing March and December become the top two flash flood months is not surprising. Over the past 20 years or so we had March 2006 with 24 events, March 2021 with 11 events, December 2010 and March 2020 with 8 events, and March 2012 and December 2008 with 7 events. I can recall some very busy days and nights from multi-day storm systems during these months. In contrast, over the same time period the highest number of November flash flood events is 6 in 2018. For October it’s 4 in 2006. And after 2018, the highest number of events in October or November is just 2.

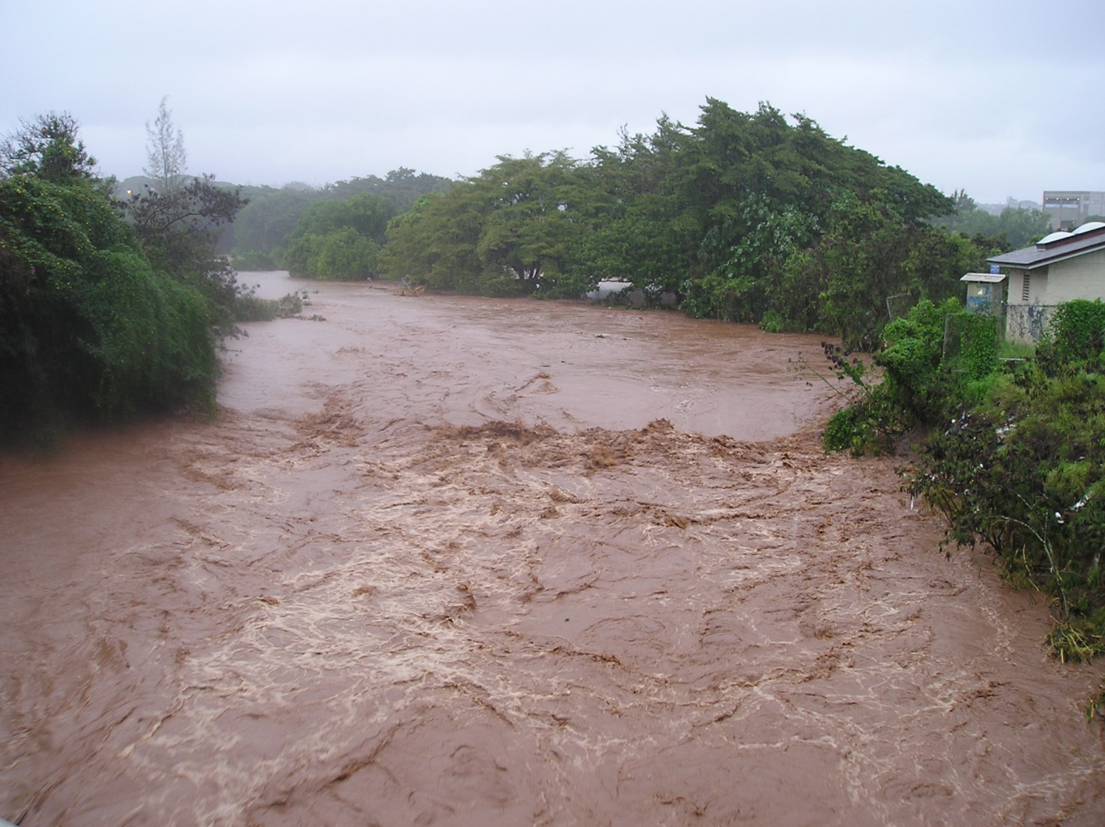
Record-breaking flow in Waikele Stream in Waipahu on December 11, 2008. Photo from the U.S. Geological Survey (USGS).
Using the same methodology as in my January 30 post, I looked at the rainfall totals for March and December going back to 1960 at the four main airports in Hawaiʻi. Plots of the March totals are shown below. In addition to the trendline based on the running 10-year average, I also added the overall linear trendline for the full data period, which I didn’t show in the October + November analysis.


Plots of March rainfall totals for Līhuʻe Airport, Honolulu Airport, Kahului Airport, and Hilo Airport from 1960 through 2025. The red dashed line is a trendline based on the running 10-year average of the totals. The black dashed line is the linear trendline over the whole time series. Data were pulled from the xmACIS2 database.
Like the October + November plots, there’s significant year-to-year variation, but the overall trend is, roughly speaking, pretty flat. One thing that does stand out is the presence of very wet months every 5 to 10 years, or so, especially at Līhuʻe Airport and Kahului Airport. Not surprisingly, these are the same months with numerous flash flood events mentioned above. Outside of these peaks, most of the March totals at both airports are below average. At Honolulu Airport and Hilo Airport, the picture is less clear. Both show a very slight downward long term trend, and if you remove 2006 from Honolulu, nothing really stands out to me.
Now let’s take a look at December (figures below). The plots for Līhuʻe Airport and Honolulu Airport show a slight downward trend that is less significant than October + November. Both also show signs of a decadal signal. On the other hand, the long term trends at Kahului Airport and Hilo Airport are really flat. The decadal signal is present at both, but is less obvious at Kahului Airport. There does not appear to be any obvious trends in the extreme months at all 4 sites. The slight downward to flat long term trend and the lack of obvious signal in the extreme months makes me wonder why the December flash flood frequency has increased so much. The October+November and the March data were consistent with the changes in flash flood event frequencies, but not so for December. It probably requires a deeper dive by looking at the circumstances surrounding the events themselves since I can’t think of any obvious reasons at the moment.


Plots of December rainfall totals for Līhuʻe Airport, Honolulu Airport, Kahului Airport, and Hilo Airport from 1960 through 2025. The red dashed line is a trendline based on the running 10-year average of the totals. The black dashed line is the linear trendline over the whole time series. Data were pulled from the xmACIS2 database.
Similar to my analysis of the October+November data, a look at March and December produces more questions than answers. I will probably do a final post on the topic down the road to cover the overall wet season trends and throw in data from a few additional stations. One last thing for this post. It’s now March, which means we’re in the month with the highest flash frequency. In fact, based on latest model runs we could have a significant heavy rain event starting around the middle of next week! So have a plan, stay tuned to the latest information from the Honolulu Forecast Office and your favorite media outlets, and be safe!
One response to “Hawaiʻi’s Wet Season, Part 2 – Additional Trends”
[…] mentioned in last week’s post, March has become the month with the highest flash flood frequency in the state. And right on […]