
Note: This blog post will NOT be updated with the latest forecast information regarding the ongoing heavy rain and wind event. For the latest community updates, please stay tuned to your local media outlets, and check on the latest official forecasts, watches, and warnings on the Honolulu Forecast Office’s (HFO) website.
As mentioned in last week’s post, March has become the month with the highest flash flood frequency in the state. And right on schedule, we’re in the middle of an evolving weather event that could end up being the most impactful of the 2025-2026 wet season. The storm system producing all of this inclement weather started out over eastern China on February 28. The satellite loop below shows that the system tracked northeastward over and to the east of Japan, then moved east to east-southeast into the central North Pacific on March 7.

Loop of color enhanced infrared (IR) images from the Himawari-9 satellite covering the period from 2 PM HST February 28 to 2 PM HST March 7. The images come from the RAMMB/CIRA SLIDER archive and are spaced 12 hours apart. Annotations in yellow are my own.
The atmospheric pattern aloft was interesting in that there was a negatively tilted blocking pattern over the far North Pacific and the western Aleutian Islands. The blocking pattern shoved the jet stream southward and resulted in a nearly stationary negatively tilted trough northwest of the main Hawaiian Islands. The pattern is shown in the map below. In my February 27 post, I mentioned that negatively tilted troughs aloft can help produce very intense rainfall and thunderstorm activity.

Geopotential heights and winds at 200 millibars from the GFS model’s 00-hr panel valid at 2 AM HST, March 9, 2026. The figure was downloaded from the NCEP Model Analyses and Guidance website. I added a red oval to identify the main Hawaiian Islands, a red dashed line to show the position of the low pressure trough, and a blue solid line to show the high pressure ridge axis at this level in the atmosphere. The position of the jet stream was also noted.
The models have been hinting at a big rain event for over a week. The figure below shows a meteogram of 24-hour precipitation forecasts at Honolulu Airport from the ECMWF (“European”) model’s 2 AM HST ensemble forecast system run on March 4, 2026. Ensembles try to account for errors and uncertainty in the model’s initial conditions. The model’s initial states are “tweaked” in different ways, and each “tweak” is run to produce a different forecast “member”. Looking at the collection of members allows forecasters to get a feel for the uncertainty in the model forecasts. Most, if not all, of the main operational models, such as the ECMWF, the National Weather Service’s GFS, and the Canadian GEM have forecast ensembles in addition to the deterministic run of their model. The ECMWF uses 50 ensemble members plus one “untweaked” control run in their system.
In the meteogram, the 24-hour precipitation forecasts showed the possibility of a big rain event in the 7- to 10-day time frame. This graphic is just for Honolulu Airport, but you could see similar signals at several other locations across the state as well. The variations in the colors signifying different rainfall totals indicates considerable variation in timing, duration, and intensity, but warranted close monitoring.

Meteogram of 24-hour precipitation forecasts at the Honolulu Airport from 50 ensemble members plus one control (c00) member of the ECMWF model. The plot is from the 2 AM HST, March 4, 2026 model cycle. Forecast valid time (in Zulu/UTC) is on the x-axis. The y-axis shows the different ensemble members. The graph in the bottom of the figure summarizes the ensemble members as a “box and whisker” plot, along with the ensemble mean and the control forecast. I added a black box to highlight the period of the heavy rain event. The graphic is from WeatherBELL Analytics.
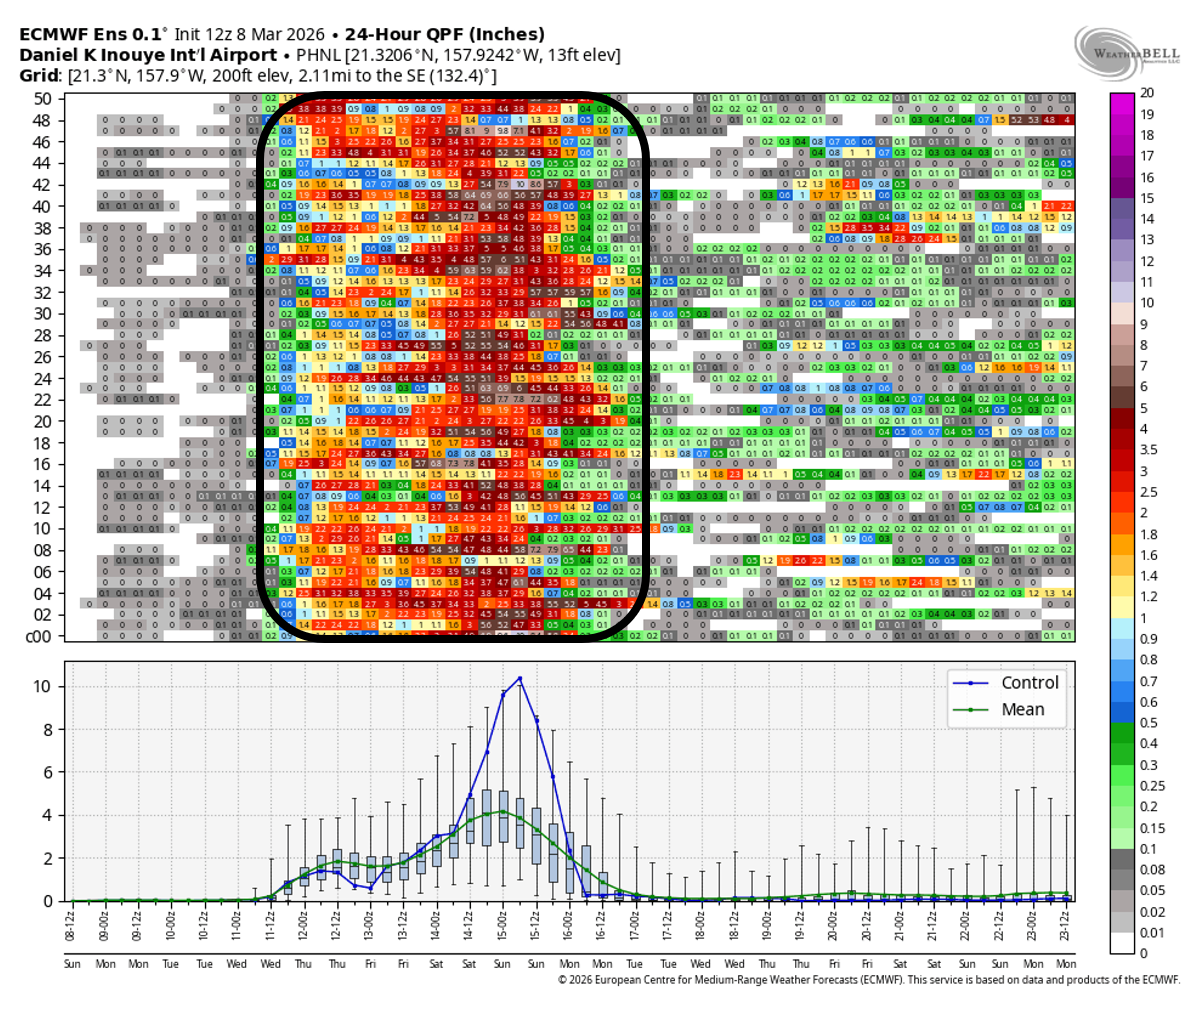
Taking a look at the same chart from a model run 4 days later (below), you can see that the ensemble member rainfall totals not only increased in consistency, but there are more members indicating significant totals. This gives forecasters higher confidence that something big could happen.

Same as above, but for the 2 AM HST, March 8 run of the ECMWF ensemble forecast system.
We can also look at the ensemble data from other models. The meteogram below is from the GFS ensemble forecast system for the same date and time as the previous panel. The GFS ensemble uses 30 members plus a control member. While the member mean is lower than the mean from the ECMWF, it nevertheless shows a significant rain event with pretty good consistency among its members for timing and intensity. So when you have a solid, consistent signal among not only the ensemble members from one model, but also in other models, it helps build your confidence on the likelihood of a significant event.

Same as above, but for the GFS ensemble forecast system.
The rainfall started in earnest on Wednesday, March 11 with a short wave trough producing an episode of rain across portions of the state. Another short wave followed on Thursday that produced some flooding impacts in the Waialua and Waiʻanae areas of Oʻahu, and in Kahului on Maui. The graphic below is an analysis using daily rainfall grids from the Hawaiʻi Climate Data Portal (HCDP). It shows peak 2-day totals of 4 to 8 inches from Kauaʻi to Maui. The Big Island had much less rainfall from this initial phase of the event, with 1 to 2 inches over the Kaʻū District and southern Puna District.

Map of gridded rainfall in inches for the 2-day period from March 11th through 12th, 2026. Note that this map covers only the initial phases of the overall event. The data come from the HCDP daily rainfall data grids.
As I’m typing up this post, it’s raining with gusty south winds at my place in Honolulu. A look at the HFO Local Storm Report (LSR) page shows numerous impacts from today with a lot of downed trees and flooding of roads. Based on the latest forecast from HFO, conditions are expected to get worse today and tonight. Taking a look at the simulated IR satellite image loop from the ECMWF model (below), deep convection and layered clouds are expected to shift eastward through the weekend.

ECMWF simulated color enhanced IR image loop centered on the main Hawaiian Islands covering the period from 2 AM HST, March 13 through 5 AM HST, March 15, 2026. In this enhancement scale, gray shades are either the surface or low cloud tops. Blue, green, yellow, and orange shades are high cloud tops
Since this storm system is producing deep southerly winds across the state, the heaviest rainfall amounts are expected to occur over the normally drier leeward areas. Many of these areas are also urbanized and are more vulnerable to flooding impacts. Areas of concern include, but are not limited to:
- Kauaʻi:
- Waimea
- Kōloa, especially near Waikomo Stream, and in the Wailāʻau Road area.
- Wailua River outlet, especially at the marina.
- Oahu:
- Numerous urban areas from Waiʻanae to Hawaiʻi Kai.
- Kamehameha Highway at Waikāne Stream and Waiāhole Stream.
- Waialua/Otake Camp: Water in Lake Wilson is nearly at spillway level of the Wahiawā Dam. If there is another big burst of rain, a lot of water will be flowing over the spillway and down Kaukōnāhua Stream.
- Molokaʻi:
- Kamehameha V Highway (Highway 450) at several low water crossings.
- Kaunakakai Gulch, at the low water crossing just west of Kaunakakai town.
- Maui:
- Kīhei to Wailea, especially along and near the normally dry waterways such as Kūlanihākoʻi Gulch.
- Piʻilani Highway, especially at Kālepa Gulch, Pahihi Gulch, and Hāwelewele Gulch.
- Māʻalaea, especially the condos east of the harbor.
- Lahaina to Kāʻanapali.
- Big Island:
- Highway 11 (Māmalahoa Highway) at Kāwā Flats south of Pāhala.
- Multiple locations along Wood Valley Road.
- Cane Haul Road and Kaʻalāiki Road southwest of Pāhala and mauka from Highway 11.Māmalahoa Highway (Highway 11).
I will end here, as I have done previously, by adding some preparedness tips and resources for reference. I’ll likely do a wrap up post next week to cover the full event rainfall totals and additional analyses. Be prepared and be safe!
- Do not drive on roads with fast-flowing water.
- Just 1 to 2 feet of fast-flowing water can sweep most vehicles off a road.
- Do not walk across flooded streams.
- If you’re hiking and get stranded, wait for the water to recede.
- Expect other rainy weather impacts.
- Increased road travel times.
- Possible detours or road closures due to flooding or landslides.
- Outdoor activities may be postponed, canceled, or adjusted.
- The wet season brings increased potential for lightning strikes.
- Be prepared for power outages, especially when thunderstorms are forecast.
- Move indoors when you hear thunder or see a flash of lightning.
- Lightning strikes can occur even in areas where it is not raining.
- Although rare, thunderstorms occasionally produce damaging winds, large hail, and tornadoes in Hawaiʻi.
- If you live in a flood-prone area, have an evacuation plan in case flood waters quickly threaten your home.
Additional resources:
- Hawaiʻi Emergency Management Agency (HIEMA): HIEMA’s website contains a wealth of preparedness information for many natural hazards.
- County Emergency Management Agencies: Your respective county emergency management offices will have specific information affecting your county, including availability and status of evacuation shelters.