
As I’m writing this post, rainfall from a second kona low is impacting Oʻahu. Some locations in the central and northern portions of the island have received more than 10 inches in 12 hours. A Flash Flood Emergency was issued for north Oʻahu, and flooding impacts have been extensive in the Waialua, Haleʻiwa, and Pūpūkea areas. Areas downstream from the Wahiawā Dam were evacuated due to the risk of a dam failure from very high water levels in Lake Wilson. This is an ongoing event, and I will likely do a post-event analysis for next week’s blog entry.
However, for this post I will be commenting on last week’s kona low, which may have been the worst non-tropical cyclone storm system to affect the main Hawaiian Islands since the kona low of January 1980. I spent over 30 years either working operations at the Honolulu Forecast Office (HFO) during heavy events, or studying these kinds of systems as a grad student and junior researcher at the University of Hawaiʻi at Mānoa. I’ve seen more intense systems (April 2018, Kauaʻi, and November 2000, Big Island), but I don’t recall a storm since January 1980 with high intensity over such a broad span of coverage.
Based on information from a post flood report by the State of Hawaiʻi Department of Land and Natural Resources (Haraguchi 1980), I think the January 1980 storm hit the state harder than the March 2026 system. I’m not talking about the amount of damage, but just the amount of rain, level of surf, presence of severe thunderstorms, and possibly the strength of the winds.
The image below is an archived infrared satellite image from GOES-3 (we’re on GOES-18 now!) showing the January 1980 kona low as it’s impacting the state. The surface low pressure center is far northwest of Kauaʻi in the image, but the primary rain band (in white) is over the main Hawaiian Islands.

GOES-3 infrared (IR) satellite image from 1:45 PM HST, January 8, 1980. The image is from the NCEI GIBBS archive. The main Hawaiian Islands are within the yellow oval.
Main impacts from the storm occurred on January 8th to 10th, 1980, and included a peak rainfall observation of 54 inches in 3 days (on Maui), a destructive tornado over Pacific Palisades (Oʻahu), and south shore surf of 7 to 12 feet. The surf caused considerable damage along the coastal areas of Kīhei on Maui. Peak winds were 75 to 80 miles per hour on the summit of Haleakalā. It’s difficult to compare winds between the January 1980 and March 2026 systems because there are many more wind data sites now than back in 1980.
The main impacts from last week’s event occurred on March 11th through 15th. While there were severe wind impacts, I’ll be focusing on the rainfall aspects of the kona low (this is the Mauka Showers blog, after all). Trying to also talk about the winds is too much to cover in one post, and would require a lot more analysis than I could do in less than a week! HFO provided a storm summary that covered the overall weather pattern and preliminary wind statistics so check it out at this link.
Kona lows are known to be persistent systems, which is one of the reasons why they can be so dangerous and impactful. The long image loop below shows multiple short wave disturbances rotating around a large low pressure system. These disturbances produced bouts of heavy rainfall over the state from March 11th through March 15th. The most intense episodes occurred on March 13th and 14th from Oʻahu to the Big Island.

Loop of color enhanced infrared (IR) images from the Himawari-9 satellite covering the period from 2 PM HST March 9 to 2 AM HST March 15. The images come from the RAMMB/CIRA SLIDER archive and are spaced 12 hours apart. The main Hawaiian Islands are within the red oval at the start of the loop.
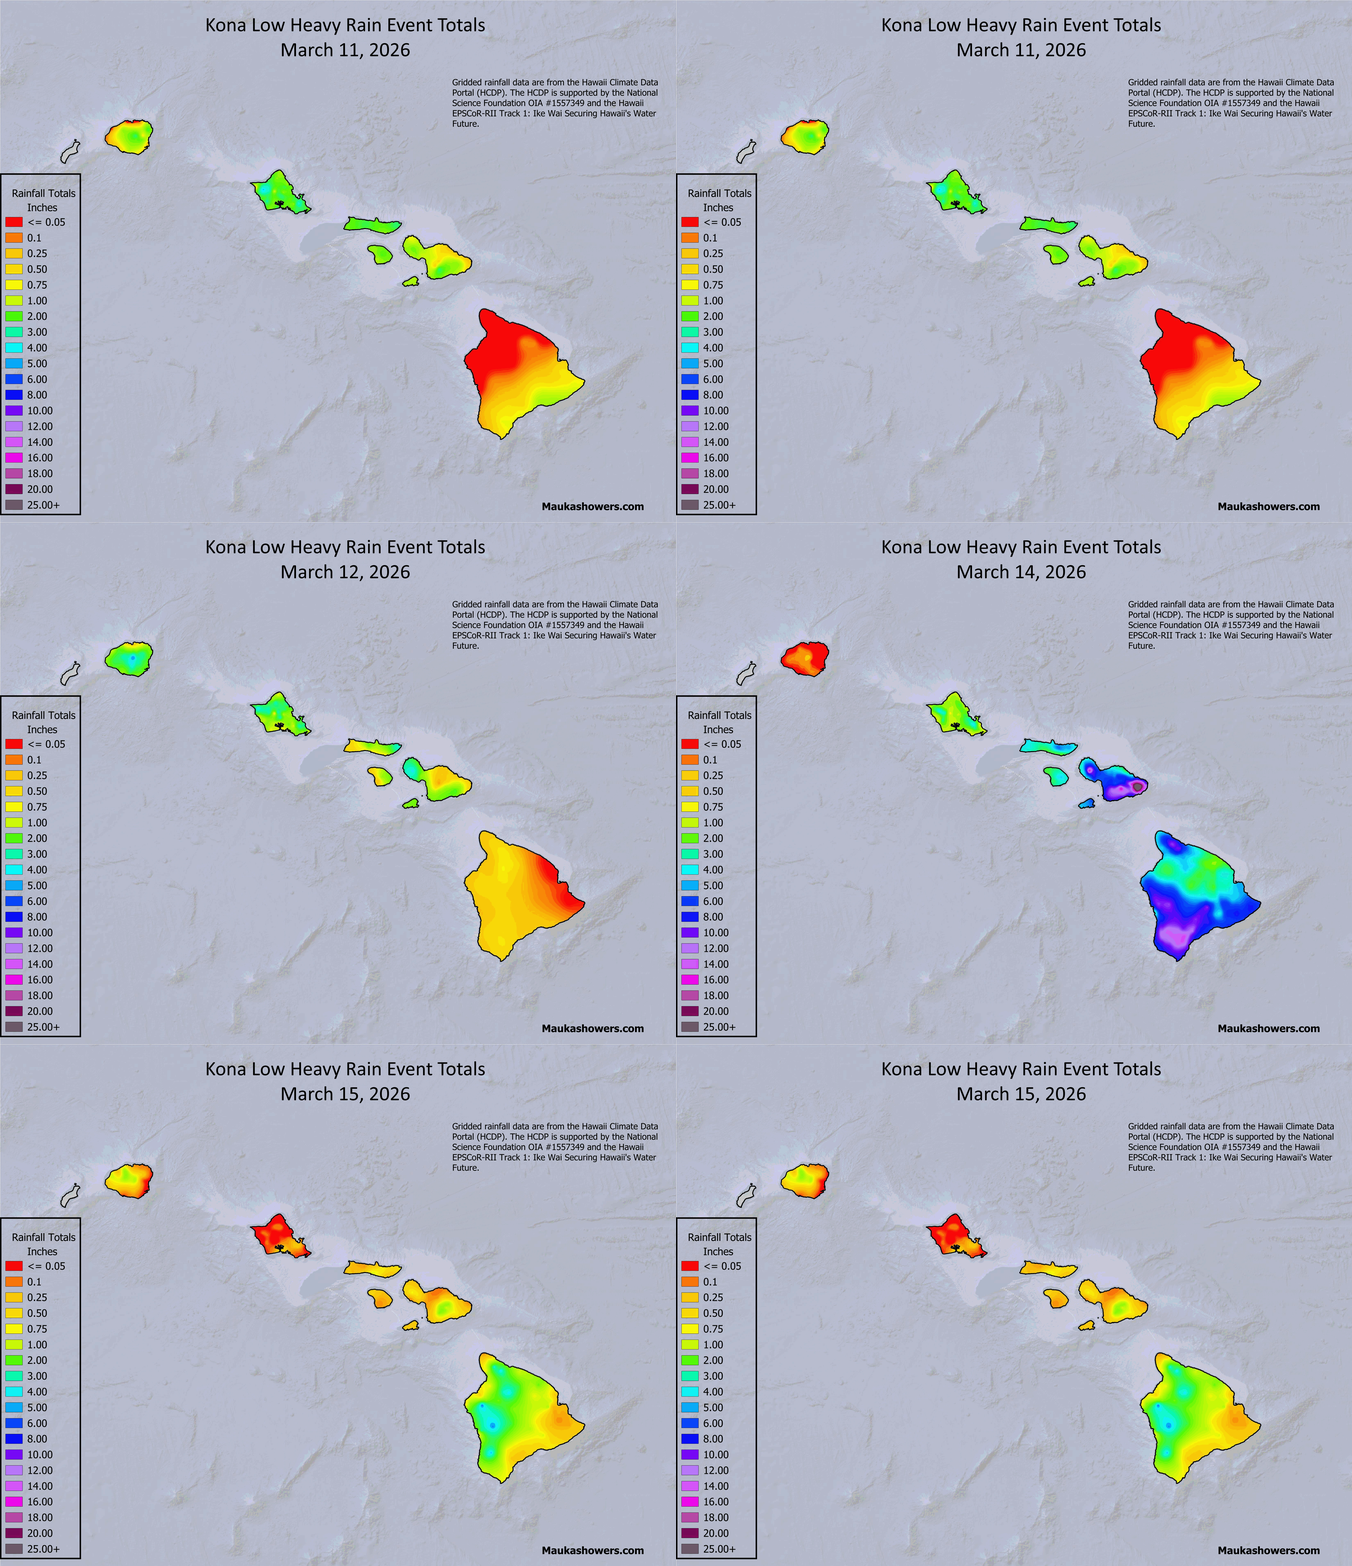
From a rainfall perspective, this was a statewide event, but the highest totals were concentrated on Maui and the Big Island (see 5-day total graphic below). The daily totals loop below shows the west to east progression and intensification of rainfall across the island chain. Peak rainfall amounts on March 13th and 14th occurred as the system picked up better upper tropospheric support while the main rain band was over Maui. Further enhancement of rainfall took place as the moist southerly low level winds slammed into the mountainous terrain. Some locations picked up an entire wet season’s worth of rainfall from just this one storm. I even had to change my normal “heavy rain event” rainfall color curve to the “2 to 4 month accumulation” curve to better handle the span of the totals!

Map of gridded rainfall in inches for the 5-day period from March 11th through 15th, 2026. The data come from the Hawaiʻi Climate Data Portal (HCDP) daily rainfall data grids.

Same as previous, but as a loop of daily rainfall totals from March 11th through 15th, 2026.
In addition to the rainfall analysis from the HCDP, I’ve also included the Multi-Radar, Multi-Sensor (MRMS) “Pass 2” precipitation analysis (map below). One of the nice things about looking at the combined radar and rain gage “Pass 2” product is that you get to look at bias-adjusted rainfall estimates over land and over the water within radar range. Ideally, the rain gage data should help correct biases in the radar-only estimates. For this to happen, 1) the radar has to be working, and 2) rain gage data for bias adjustments have to be ingested by the MRMS processing unit. Unfortunately, the Molokaʻi WSR-88D radar went out of service before the main rain bands affected the state on March 13th and 14th. It’s hard to know exactly where the degradation boundaries are, but the rainfall estimates over the mid-section of the state can’t be optimal when your radar sampling comes from the Kauaʻi and North Kohala radars.

MRMS 5-day accumulated precipitation over the state covering the period from March 11th through March 15th. The data in this graphic were downloaded from the MRMS repository on the Registry of Open Data on AWS and processed using QGIS software.
During heavy rain events over the southeast flank of Haleakalā, radar precipitation estimates are often excessively high along the upper slopes southeast of the summit. While it’s reasonable to have terrain enhancement, the radar estimates tend to be extremely high. While I was at HFO, I asked the MRMS developers at the National Severe Storms Lab about the amounts and they felt the precipitation data were contaminated by ground returns, resulting in significant overestimates. Recently, a new Remote Automated Weather Station (RAWS), named Kahikinui 1, was installed at the 5400 ft elevation, right in the zone of overestimated precipitation. Unfortunately, the new Kahikinui 1 data do not appear to have been incorporated into the MRMS processing yet, so the gross overestimates are still present. The map below shows MRMS rainfall over the southeast flank of Haleakalā along with 5-day totals from the automated rain gages in the area. Note the MRMS estimate of nearly 156 inches in 5 days over the Kahikinui 1 gage location, compared with the gage observation of 35.56 inches. Kamehamenui 1 is also a new installation on the western flank of Haleakalā. The much lower MRMS total than the rain gage amount may reflect the degraded sampling due to the unavailability of Molokaʻi WSR-88D radar data. I don’t know why Kula 1 is so much lower than the gage total. This site has been in operation for a while and I would have expected the rainfall total to adjust the MRMS value. I don’t know enough about the specific algorithm method, or if the Kula 1 data were even incorporated into the processing for the Pass 2 estimates. I guess it shows that just because you have a colorful, pretty picture doesn’t mean it’s accurate. You still need to dig into the data to verify.

Same as the above graphic, but zoomed in to the southeast flank of Haleakalā. Yellow dots indicate positions of automated rain gages in and around the maximum precipitation area. The numbers to the right of the station name are the MRMS 5-day totals, followed by the 5-day rain gage total).
As I have done in past events, I’ve included the top 5 rainfall totals for each county for the March 11th through 15th period in the table below. The rainfall totals were pulled from the Hawaiʻi Rainfall Summary (RRAHFO) text product issued by HFO and archived by Iowa State University. Since the RRAHFO product doesn’t include some of the recently installed gages (RAWS and Hawaiʻi Mesonet), I’ve added these as needed based on data retrieved from the HCDP and the WRCC RAWS archive. All of the amounts are midnight-to-midnight totals. Locator maps for each of the gages are included below the table. Since the totals come directly from the RRAHFO product, the HCDP archive, and the WRCC RAWS archive, they have not been examined for errors.
| Station | Mar 11 | Mar 12 | Mar 13 | Mar 14 | Mar 15 | 5-day total |
| Kauaʻi | ||||||
| Waiʻaleʻale | 2.13 | 5.54 | 6.47 | 0.37 | 1.04 | 15.55 |
| N Wailua Ditch | 3.32 | 3.71 | 6.26 | 0.07 | 1.15 | 14.51 |
| Waiʻalae | 1.45 | 3.15 | 5.91 | 0.25 | 1.39 | 12.15 |
| Waiahi Rain Gage | 2.17 | 2.59 | 6.37 | 0.02 | 0.83 | 11.98 |
| Mōhihi Crossing | 1.78 | 2.84 | 5.75 | 0.18 | 1.30 | 11.85 |
| Oʻahu | ||||||
| Kaʻala | 4.67 | 3.05 | 13.93 | 4.43 | 0.12 | 26.20 |
| Maunawili | 3.23 | 3.14 | 13.36 | 3.10 | 0.14 | 22.97 |
| St. Stephens | 3.54 | 2.86 | 11.71 | 4.17 | 0.39 | 22.67 |
| Luluku | 2.33 | 1.90 | 11.77 | 3.87 | 0.34 | 20.21 |
| Schofield Barracks | 3.40 | 3.15 | 8.76 | 3.57 | 0.09 | 18.97 |
| Maui Cty | ||||||
| Summit | 1.77 | 1.44 | 25.56 | 19.00 | 1.57 | 49.34 |
| Kula 1 | 3.24 | 1.46 | 18.54 | 21.40 | 1.83 | 46.47 |
| Kamehamenui 1 | 1.58 | 1.02 | 17.80 | 13.67 | 1.82 | 35.89 |
| Kahikinui 1 | 2.69 | 1.99 | 10.50 | 19.73 | 0.65 | 35.56 |
| Puʻu Kukui | 1.89 | 4.01 | 8.61 | 14.68 | 0.95 | 30.14 |
| Big Island | ||||||
| Puʻu Waʻawaʻa | 0.12 | 0.80 | 3.69 | 26.51 | 6.75 | 37.87 |
| Nāhuku | 0.98 | 0.23 | 4.30 | 27.60 | 0.96 | 34.07 |
| Keaumo | 0.71 | 0.32 | 10.64 | 14.38 | 1.10 | 27.15 |
| Kaiholena | 0.55 | 0.49 | 3.86 | 20.80 | 0.37 | 26.07 |
| Pali 2 | 1.60 | 0.52 | 2.31 | 20.79 | 0.48 | 25.70 |


Maps of locations for the top 5 rainfall totals on Kauaʻi, Oʻahu, Maui County, and the Big Island. Station location data are from the HCDP and Mesowest.
Several sites on Maui and the Big Island recorded incredibly high totals that warranted further examination. The table below shows the peak rainfall amounts (in inches) for different durations over the March 11th through 15th event. Return periods (in years) are in the rows below the rainfall amounts. The data are from the Hawaiʻi Mesonet archive and the WRCC RAWS archive. Return periods for each site are from NOAA Atlas 14. The amounts for the short term duration, while high, weren’t incredibly unusual. However, many of the longer durations, especially from 6-hours to 2-days, were extreme (>1000 year return periods!) and on the far right tails of the frequency distributions.
| Station | 15-min | 1-hr | 3-hr | 6-hr | 12-hr | 24-hr | 48-hr |
| Maui | |||||||
| Kahikinui 1 | N/A | 1.49 | 4.12 | 6.80 | 12.67 | 24.84 | 30.38 |
| < 2 | 10-25 | 25-50 | 50-100 | > 1000 | 500-1000 | ||
| Kamehamenui 1 | N/A | 2.46 | 5.79 | 10.70 | 16.45 | 23.88 | 33.06 |
| 10-25 | 50-100 | 500-1000 | > 1000 | > 1000 | > 1000 | ||
| Keālia Pond | N/A | 1.83 | 3.85 | 6.67 | 8..23 | 12.29 | 13.51 |
| 10-25 | 50-100 | 200-500 | 200-500 | 200-500 | 200-500 | ||
| Kēōkea | 1.13 | 2.11 | 4.68 | 8.53 | 12.35 | 19.81 | 23.41 |
| 10 | 10-25 | 50-100 | > 1000 | > 1000 | > 1000 | > 1000 | |
| Kula 1 | N/A | 2.51 | 6.60 | 11.71 | 19.62 | 31.43 | 41.46 |
| 10-25 | 200-500 | > 1000 | > 1000 | > 1000 | > 1000 | ||
| Pōhaku Pālaha | 0.59 | 1.78 | 4.32 | 7.23 | 12.85 | 24.56 | 30.65 |
| < 2 | < 2 | 2-5 | 10 | 25-50 | 200-500 | 100-200 | |
| Summit | 1.10 | 3.10 | 8.14 | 14.00 | 21.99 | 33.15 | 45.52 |
| 2-5 | 10-25 | 200-500 | > 1000 | > 1000 | > 1000 | > 1000 | |
| Upper Kahikinui | 0.57 | 1.50 | 3.76 | 5.47 | 9.65 | 18.80 | 21.86 |
| < 2 | 2-5 | 10-25 | 25-50 | 100-200 | > 1000 | 500-1000 | |
| Big Island | |||||||
| Nāhuku | 1.15 | 2.67 | 6.53 | 9.82 | 16.93 | 28.57 | 32.25 |
| 5-10 | 10-25 | 50-100 | 50-100 | 200-500 | > 1000 | 200-500 | |
| Puʻu Waʻawaʻa | 0.89 | 2.45 | 5.93 | 10.33 | 16.32 | 26.75 | 35.10 |
| 5-10 | 25-50 | 500-1000 | > 1000 | > 1000 | > 1000 | > 1000 |


Maps of locations for the sites included in the rainfall frequency analysis. Station location data are from the HCDP and Mesowest.
While the March 11-15, 2026 event may have been a “once-in-a-generation” occurrence, we’re not done with rainfall yet! We’ll have to see what this second kona low ultimately does to the island chain through the weekend, and it will be interesting to see where March 2026 stacks up historically. Stay safe out there!
Reference
Haraguchi, P., 1980: Post Flood Report, Storm of January 8-10, 1980, State of Hawaii. Circular C83, State of Hawaiʻi Department of Land and Natural Resources.
One response to “The March 11-15, 2026 Kona Low – Once in a Generation Storm?”
[…] storm system. As you’ll see toward the bottom of this post, the amounts were not as high as in the initial kona low, but the flooding impacts were just as severe. The main issue this time around was that soil […]