
I’m posting this a little earlier than my usual Friday publishing day. I’ll be busy with some things the next couple of days so I figured it would be better to post on Wednesday instead of waiting until the weekend. Anyway…
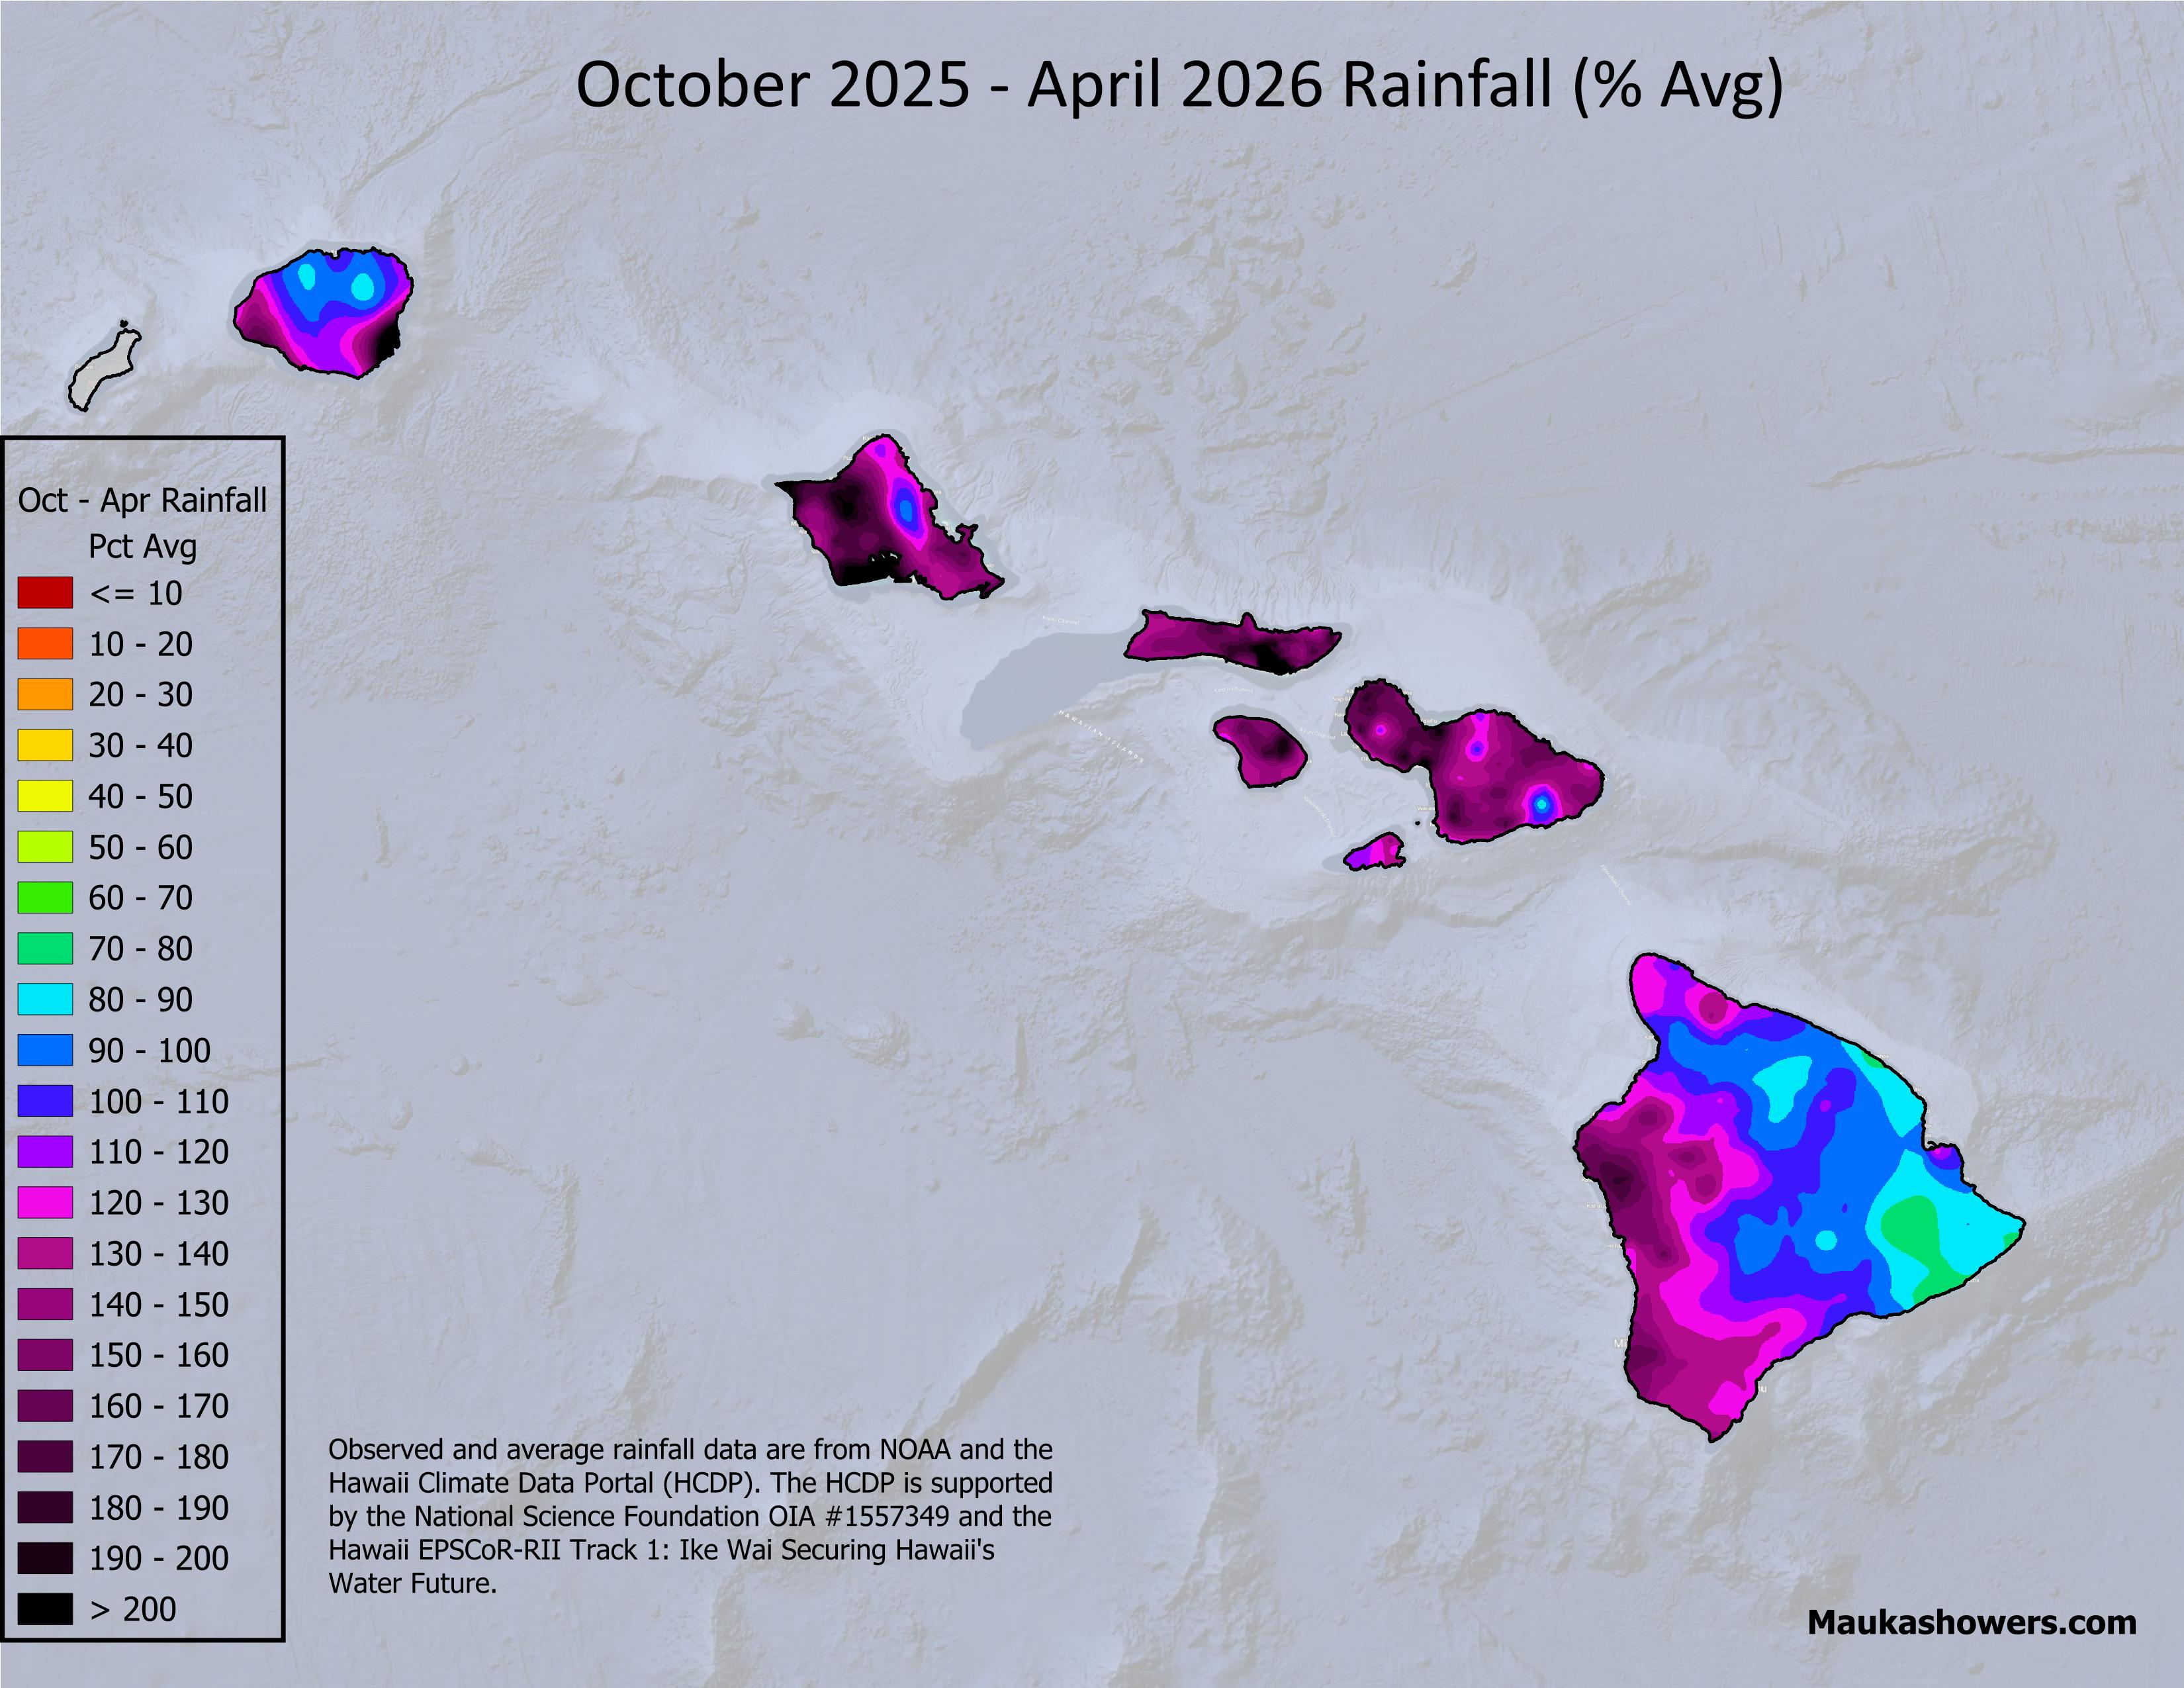
Last week I did a recap of the main weather events during the October 2025 through April 2026 Hawaiian Islands wet season (hoʻoilo). This week I wanted to go over some of the numbers and where they stand compared to previous years. The 2025-2026 wet season was actually compressed into just five months instead of seven because October and November were drier than normal overall. Despite the shorter window of opportunity, it ended up being a rather wet hoʻoilo. Most of the state had well above average rainfall (see figures below). For comparison purposes, I also included the percent of average map for the 2024-2025 wet season, which was near to below average overall.

Map of gridded rainfall in inches for October 2025 through April 2026. The data come from the Hawaiʻi Climate Data Portal (HCDP) monthly rainfall data grids.

Percent of average rainfall for October 2025 through April 2026 across the main Hawaiian Islands. Monthly rainfall data are from the HCDP. Average rainfall values are from the Rainfall Atlas of Hawaii.

Same as above but for October 2024 through April 2025. Don’t ask me why the background is different. I just noticed it as I was about to publish this and didn’t feel it was worth generating a new graphic, though I have to say it does bug the A-R side of me.
Using rank order statistics and NOAA rainfall data from eight locations with long and reliable data records, my calculations showed the 2025-2026 wet season to be tied with 1996-1997 for the wettest in the last 30 years. But that’s just my unofficial numbers. We’ll have to wait and see what the Honolulu Forecast Office says later this month.
The 1996-1997 wet season occurred prior to the development of a “super El Niño” the following summer. This year could also have a “super El Niño” so the similarity is interesting. One big difference is that back in 1996-1997 the rainfall was front-loaded with much higher amounts in the first half of the wet season than the second half. November was particularly wet. There was the “Election Day Storm” on November 5, 1996 on Oʻahu, followed by other heavy rain events later that month. Honolulu Airport had more rain in November than all the other months in the wet season combined. We haven’t seen that kind of a wet season in a while.
Amazingly, as much as it rained in the 2025-2026 wet season, a look further back in the data shows that it doesn’t even crack the top 5 for any of the long period of record sites I have available. These are the Līhuʻe Airport, Honolulu Airport, Kahului Airport, Hilo Airport, ʻUlupalakua Ranch, and Kapāpala Ranch. Though it varies from site to site, some of the notable really rainy wet seasons include 1978-1979, 1981-1982, and 1988-1989. For some reason Honolulu Airport had several really rainy wet seasons in the mid- to late-1960s but these don’t show up as prominently at the other locations.
Looking at drought conditions, the start of the 2025-2026 hoʻoilo had drought in all four counties across the state (see below). The worst drought conditions were on the Big Island with pockets of extreme drought (D3 on the U.S. Drought Monitor map). Due to the dry conditions in October, drought actually got worse early in the wet season, and by mid-November, extreme drought developed in central Maui. The rainy conditions from December through April wiped out all drought (D0 is technically not drought) in the state by the end of the wet season. The USDM map from May 5 shows a few patches of D0 on the Big Island and Maui. Personally, I don’t know why D0 is still on the map. It could be that the USDM is just a bit slow to respond and hopefully it will be removed soon.

U.S. Drought Monitor (USDM) map for the main Hawaiian Islands as of October 7, 2025. The D1-D4 categories are the different levels of drought. The D0 category, for abnormally dry conditions, can be considered as “pre-drought”.

Same as above but for May 5, 2026.
Now that we’re in the Hawaiian Islands dry season (kau), what can we potentially look forward to (beyond the obvious longer days and warmer temperatures)? The Climate Prediction Center (CPC) issued an El Niño Watch in early April so they’re expecting the current ENSO-neutral conditions to transition to El Niño at some point in the next few months. The conditions across the Pacific are clearly trending toward an El Niño event, and looking at CPC’s probabilities (below) it’s not really a question of if an El Niño develops but how strong will it be? Based on the CPC El Niño Southern Oscillation (ENSO) strength probabilities, it looks like there’s a pretty good chance for a strong or even a very strong (“super”) El Niño event. The last time we had a “super El Niño” was in 2015-2016.

NOAA CPC’s 3-month probabilities for El Niño (red), La Niña (blue), and ENSO-neutral (gray). The x-axis shows 3-month seasons from March-April-May (MAM) through November-December-January (NDJ).

NOAA CPC’s 3-month ENSO strength probabilities for El Niño (red shades), La Niña (blue shades), and ENSO-neutral (gray). The x-axis shows 3-month seasons from March-April-May (MAM) through November-December-January (NDJ).
In my April 3 post, I mentioned that the development of an El Niño event usually results in more tropical cyclones in the Central North Pacific basin. NOAA will be issuing their outlook covering the tropical cyclone numbers for the 2026 hurricane season later this month. Given the climate trends in the Pacific, the odds favor a forecast calling for more than the normal of four to five tropical cyclones (tropical depressions, tropical storms, and hurricanes), and a season extending beyond the normal November 30 end date.
What about rain? I also mentioned in my April 3 post that above normal rainfall is expected in the summer prior to El Niño onset, regardless of intensity. The latest North American Multi-Model Ensemble (NMME) forecast posted last week shows probabilities favoring wetter than normal conditions across Hawaiʻi (see loop below) during the summer months. In the last “super El Niño” (2015-2016), Hawaiʻi had its wettest dry season in 30 years. Will 2026 be the same as 2015? There’s no way to know for sure. All we know now is that the odds from historical and numerical model guidance favor wetter than normal conditions. So this is good for the agriculture sector and for a calmer fire season, but bad for possible flooding impacts.
You may have also noticed the really strong dry signal at the end of the loop in December. This is another hallmark of a strong El Niño…very dry conditions across the Hawaiian Islands in the winter following El Niño onset. So there’s a pretty good chance that we’ll go from a very wet 2025-2026 wet season to a very dry one in 2026-2027. Talk about climate whiplash!

Loop of monthly precipitation forecasts from the May 2026 run of the NMME (Kirtman el al., 2014). The loop covers the period from June through December 2026. Brown shades are areas where probabilities favor below normal precipitation. Green areas favor above normal precipitation. The red oval indicates the location of the Hawaiian Islands.
I guess a way to summarize the next few months is that if you were wishing for a break from the insane weather in the wet season…unfortunately the chances are that your wish will not be granted. We could be headed for a pretty eventful dry season this year. Stay tuned, and be prepared!
Reference
Kirtman, B.P., D. Min, J. Infanti, et al., 2014: The North American multimodel ensemble: Phase-1 seasonal-to-interannual prediction; Phase-2 toward developing intraseasonal prediction. Bull. Amer. Meteor. Soc., 95, 585-601.