
Note: The rainfall totals provided here are from online sources and have only basic quality control applied to remove obvious errors. The values from the data sources may change in the future as corrections are made by the responsible data custodians.
On multiple occasions over the past several weeks, I’ve mentioned that the Hawaiian Islands wet season runs from October through April. Heavy rainfall and flash flood events tend to occur more often during this period. The May through September time frame is considered to be the dry/warm season. However, that doesn’t mean heavy rainfall and flash flooding suddenly stops just because you passed April 30! Remember, flash flooding events can occur in any month of the year. While not common, we can even have pretty “beefy” kona lows in May, as we did in 2024. Speaking of which, I noticed that folks are referring to the March storms as “Kona low storms”. Local meteorologists, at least the ones I know, call them either “kona lows” or “kona storms”, so I don’t know why they suddenly became the longer and redundant, “kona low storms”. After all, we don’t say “three tropical storm storms affected the islands” or “two tropical depression storms caused flash flooding”. Anyway, not a big deal. It’s like a flea bite…an annoyance that I have to scratch.
All that to say, we had a flash flood event on Oʻahu last week Friday (May 15), and while we’re technically in the dry season, these events can and do happen during this time of the year. It was a rather impressive event, with very high rain rates in some spots, frequent lightning, and even some small hail. Impacts included flash flooding on Kamehameha Highway (Honolulu Forecast Office Local Storm Report), and numerous power outages (Hawaiian Electric press release).
What was the cause of all the ruckus? The main culprit was a low pressure system aloft that dropped into the area from the north on May 15th, which made the local air mass rather unstable. Fortunately, the low moved fairly quickly so that it hit hard, but the impacts were relatively short-lived. The water vapor image loop below shows the circulation of the low aloft as it moves over the main Hawaiian Islands. The water vapor channel shows moisture in the middle and upper portions of the atmosphere, so this type of imagery is useful for tracking low pressure systems aloft. The second loop contains visible imagery overlaid with Geostationary Lightning Mapper (GLM) data from 8:01 AM to 10:01 AM HST, on May 15. Just tracking the lightning flash density data (greens, yellows, and reds), you can watch the southward progress of the low as it helps initiate thunderstorms.

NOAA/NESDIS GOES-18 color enhanced water vapor (WV) image loop covering the tropical central and east Pacific on May 15, 2026. In this enhancement curve, blues/whites/greens are areas with high moisture content in the middle and upper portions of the atmosphere. Yellows and oranges are areas with drier air aloft. Annotations in yellow and red are my own.

NOAA/NESDIS visible image loop centered on the main Hawaiian Islands with Geostationary Lightning Mapper (GLM) data overlaid. The loop covers the period from 8:01 AM to 10:01 AM HST, May 15, 2026. For more information on the GLM data, please click here.
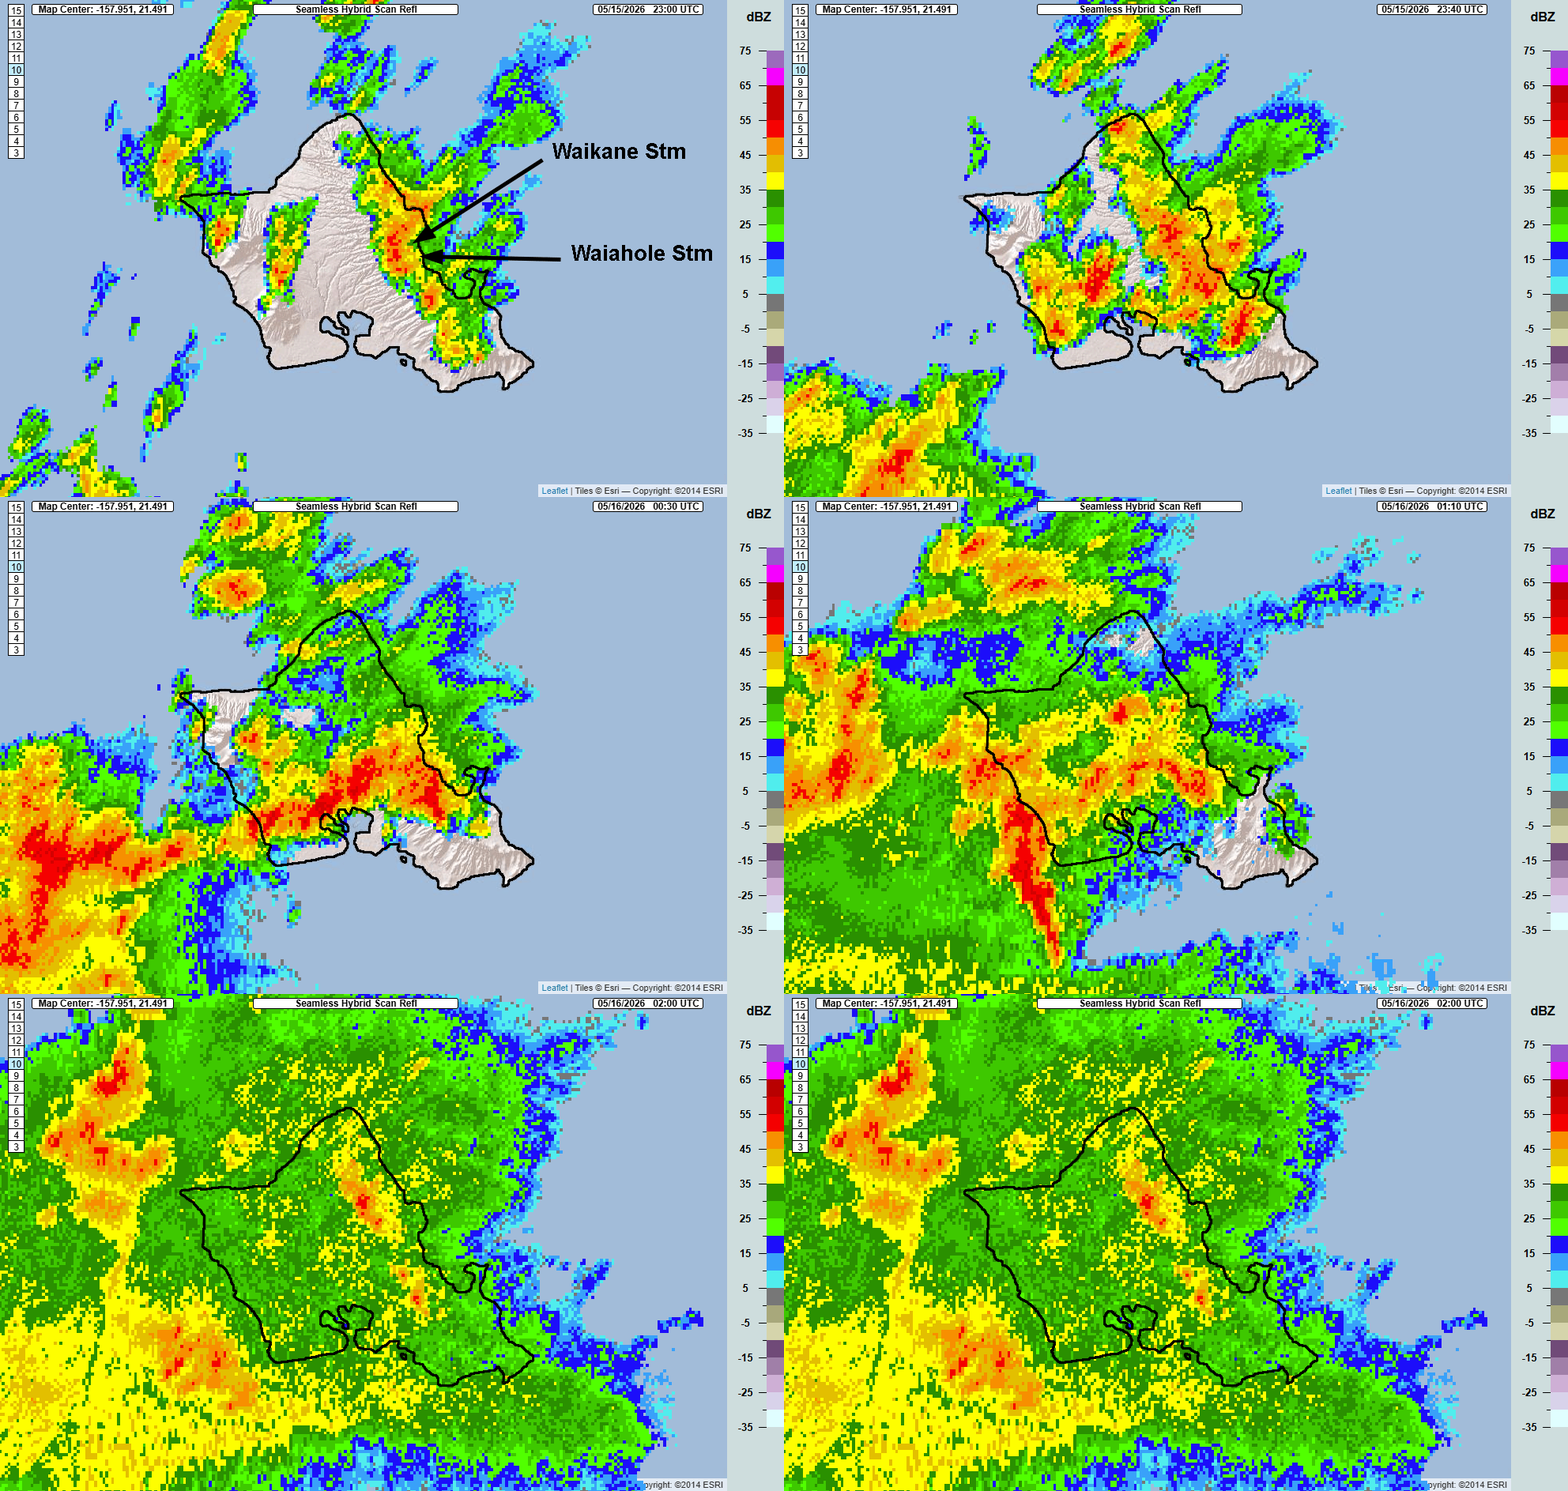
After some passing heavy showers in the morning, a more significant area of heavy rain initiated over the windward slopes of Oʻahu’s Koʻolau Range around noon as the instability from the low pressure system aloft moved over the area (see loop below). The hydrographs below show that Waikāne Stream and Waiāhole Stream both responded shortly after 12:30 PM with rapid increases in water levels. By mid-afternoon, HFO reported that runoff from both streams was affecting Kamehameha Highway.

Seamless Hybrid Scan Reflectivity mosaic from 1 PM to 4 PM HST, Friday, May 15, 2026 from the NOAA National Severe Storms Lab’s Multi-Radar/Multi-Sensor (MRMS) system website. The images are in 10-minute intervals, and the red colors indicate the most intense rainfall areas. The images from the website were cropped for visual clarity. Annotations at the start of the loop are mine.

Hydrograph of water level data from the U.S. Geological Survey’s gage at Waiāhole Stream centered on May 15, 2026. The image is from NOAA’s National Water Prediction Service (NWPS).

Same as above, but for Waikāne Stream.
You may have noticed in the radar loop above that the intense rainfall quickly spread from the Koʻolaus into central and west Oʻahu. This can also be seen in the GLM loop below as lightning activity increased and spread over large portions of the island. A social media post from HFO indicated that there were over 10,000 lightning strikes over Oʻahu from 1 PM to 4 PM HST! It was during this time period that flooding occurred in Waipahu and Kunia. Several social media posts also showed small hail in the Kunia area around 2:30 PM HST. The hail report is consistent with the location, timing, and size of hail indicated by the MRMS Maximum Expected Size of Hail (MESH) guidance (below).

NOAA/NESDIS visible image loop centered on the main Hawaiian Islands with Geostationary Lightning Mapper (GLM) data overlaid. The loop covers the period from 1:01 PM to 3:01 PM HST, May 15, 2026.

MRMS Maximum Expected Size of Hail (MESH) data from 2:20 PM HST, May 15, 2026. The yellow colors over the Kunia area indicate maximum sizes of around ½ to ¾ inch diameter.
The transient nature of the low aloft meant that most of the event was confined to a 12-hour period for Oʻahu. The MRMS radar and rain gage rainfall estimate showed most of the island receiving over half an inch of rain, with localized higher amounts of 4 to 8 inches where the most intense thunderstorms occurred (figure below). It’s fortunate that this was a short-lived event because the short duration rainfall rates were impressive. The rain gage at Kunia recorded 2.10 inches in a 15-min period (yes, >8 inches per hour!) from 2:15 PM to 2:30 PM HST, which was the highest 15-min amount I’ve seen so far this year. Luckily, the thunderstorm producing the rain didn’t linger over the same area for too long. Otherwise, the resultant flooding would have been much worse.

MRMS Pass 2 (radar and rain gage) 24-hour accumulated precipitation estimate for May 15, 2026. The data in this graphic were downloaded from the MRMS repository on the Registry of Open Data on AWS and processed using QGIS software. Blue dots are gage locations listed in the table below. Red polygons are the locations of the basins for the above-mentioned Waikāne Stream and Waiāhole Stream.
The table below shows the peak rainfall amounts (in inches) for different durations on May 15 from the three sites with the highest rainfall. Return periods (in years) are in the rows below the rainfall amounts. The Kunia totals are from the 15-minute data available on the HADS website. Data for the Moanalua RG and Hālawa Tunnel RG sites are from the USGS. Return periods for each site are from NOAA Atlas 14.
| Station | 15-min | 1-hr | 3-hr | 6-hr | 12-hr |
| Kunia | 2.10 | 4.84 | 5.41 | 6.44 | 7.21 |
| 100-200 | 500-1000 | 50-100 | 50-100 | 25-50 | |
| Moanalua RG | 1.37 | 4.72 | 5.66 | 6.18 | 6.19 |
| 2-5 | 25-50 | 5-10 | 2-5 | 2-5 | |
| Hālawa Tunnel RG | 1.12 | 3.52 | 6.15 | 7.09 | 7.11 |
| <2 | 5-10 | 10-25 | 5-10 | 2-5 |
Last week’s event was a reminder that even though we’re in the “dry season”, we can still have heavy rain events and still need to be on our toes. This is especially true this year due to the high probability of an El Niño developing this summer. The onset of El Niño conditions is expected to increase tropical cyclone activity in the central North Pacific, potentially resulting in more heavy rain events over the Hawaiian Islands.
One response to “Not Done Yet! Intense Rain Event Hits Oʻahu”
[…] Back on February 20th, I did a post on what clouds in weather satellite images look like from an airplane. The weather conditions on the day of that flight were fairly benign, with light low level winds from the east to southeast. Despite the stable conditions, there were still interesting features to identify, but I thought it would be really interesting to do a similar thing during unsettled weather. I didn’t have to wait too long for that opportunity. On May 15th, a low pressure system aloft brought unstable atmospheric conditions to portions of the state. The event produced thunderstorms, flash flooding, and even small hail over Oʻahu, which I wrote about in last week’s post. […]