
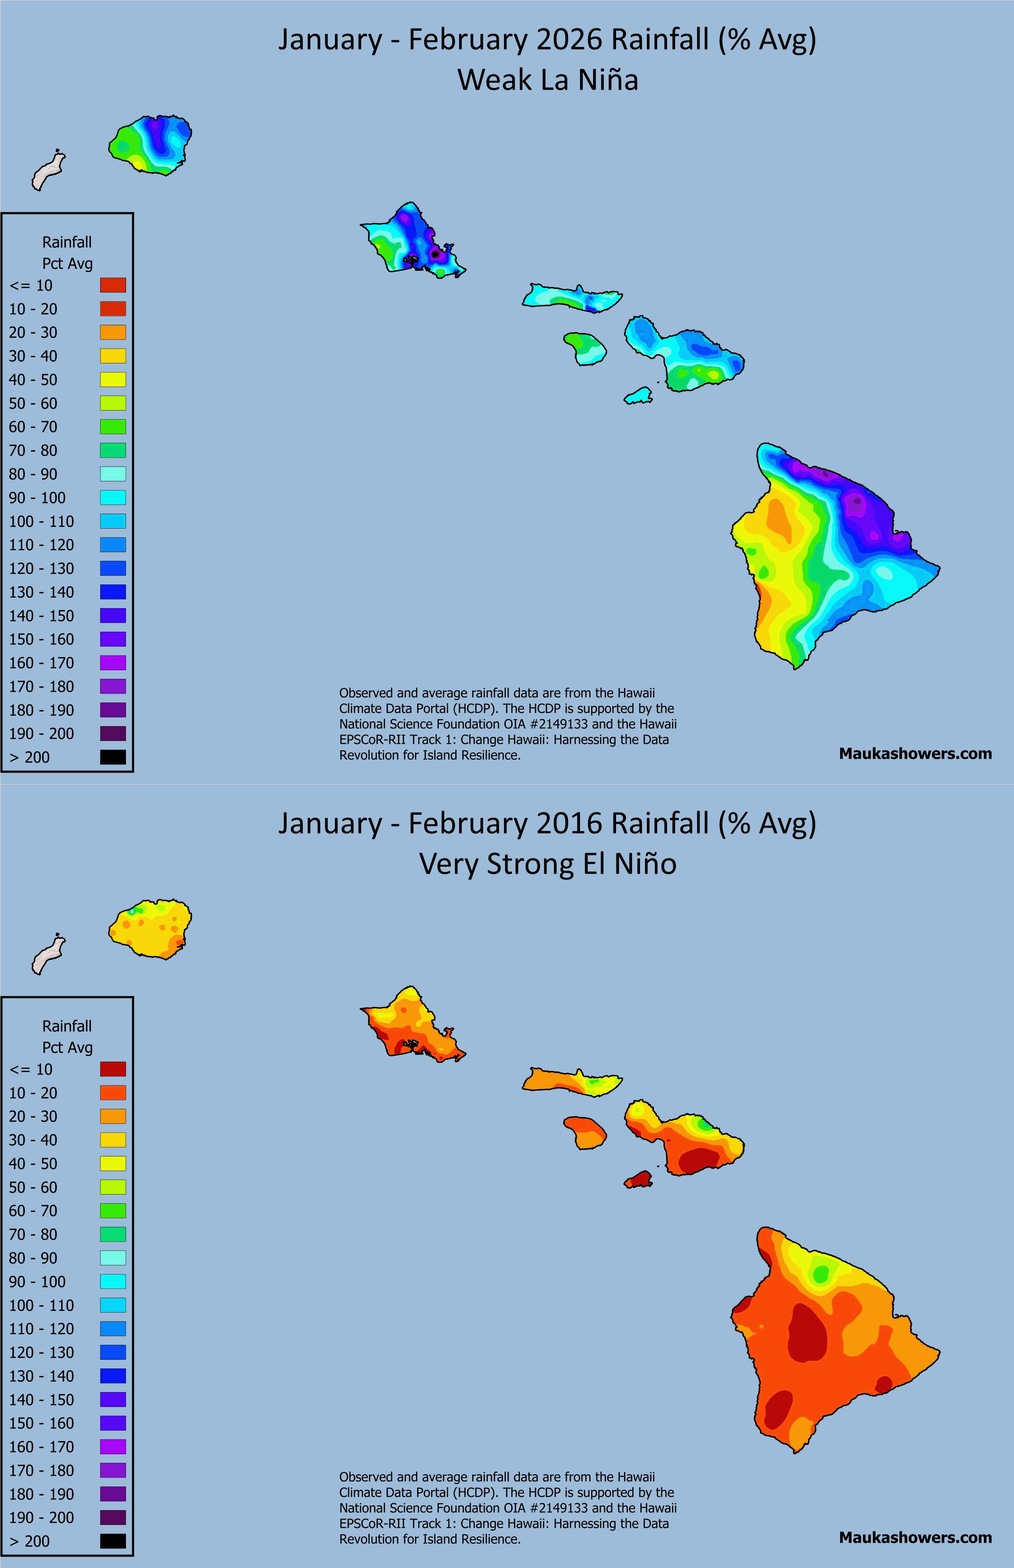
Last week I showed wet season rainfall at various locations across the State of Hawaiʻi during recent El Niño events. I realized after compiling the data for that post that it would be useful to show statewide maps because most people do not live/work/play at the specific gage locations I highlighted, and also to reveal spatial patterns. This is now possible due to the availability of high resolution rainfall grids from the Hawaiʻi Climate Data Portal (HCDP). With this in mind, I created rainfall maps based on the same El Niño Southern Oscillation (ENSO) events in last week’s post.
If you didn’t see it, my post from last week showed October through April monthly rainfall at several locations across the state as percent of average values. The intent was to highlight the changes in the monthly anomalies in the Hawaiian Islands wet season during an El Niño event. Since El Niño events vary in strength, I used the most recent weak event, in 2018-2019, moderate event (2023-2024), strong event (2009-2010), and very strong event (2015-2016). I also included data from the last ENSO-neutral event (2019-2020) and the recent weak La Niña in 2025-2026 for comparison purposes. These ENSO strength categories are based on the NOAA Climate Prediction Center’s (CPC) Relative Oceanic Niño Index (RONI).
The rainfall maps in this post use monthly rainfall grids from the HCDP and monthly average rainfall grids from the Rainfall Atlas of Hawaiʻi to calculate percent of average values for the entire October through April wet season. Since El Niño dryness tends to be most focused in January and February, I created a separate set of maps showing the percent of average values for just these two-months.
Before I list my general observations, I should mention that every ENSO event is different, even if they’re within the same strength category. Additionally, rainfall impacts may not occur smoothly as you progress from, say, a weak El Niño to a very strong El Niño. This is nature, so there will always be some messiness involved. So in no particular order, here are my general take-aways from the maps:
- There is a general trend of increasing dryness across the state as you progress from a weak El Niño event to a very strong one for total wet season rainfall with exceptions unique to specific events..
- The very strong El Niño in 2015-2016 had rainy conditions well into December, especially along the windward slopes, before the large-scale dry pattern became established. This contributed to the percent of average values being higher (wetter) than the 2009-2010 strong El Niño event.
- Moderate El Niño events are usually pretty dry, but the 2023-2024 event shown here was unusual in that Hawaiʻi caught a couple of cold fronts in early and mid-January that produced a decent amount of rain, and then the surface high pressure ridge went so far south of the state that the islands were in moist southwesterlies for several days. Several sites in Upcountry Maui ended up with their wettest January on record. So much for the “dry January and February” forecast!
- Weak El Niño events can still produce rather rainy wet seasons, as was the case in 2018-2019. Weak events can be “leaky” and can still allow significant heavy rain events to affect the state, which makes it tougher to do a long range rainfall outlook. So instead of saying, “IT’S GOING TO BE A DRY WET SEASON, ESPECIALLY IN JANUARY AND FEBRUARY!!”, you have to temper your enthusiasm and quietly say, “it might be a dry wet season, especially in January and February?”
- Wet seasons under ENSO-neutral conditions are often wetter than normal. I mentioned in my last post that a while back I found that 7 out of the top 10 wettest wet seasons occurred during ENSO-neutral events.


Maps of rainfall as percent of average values for the October through April wet season for the most recent weak La Niña (2025-2026), ENSO-neutral (2019-2020), weak El Niño (2018-2019), moderate El Niño (2023-2024), strong El Niño (2009-2010), and very strong El Niño (2015-2016) events. The maps are based on monthly rainfall grids from the HCDP and monthly average rainfall grids from the Rainfall Atlas of Hawaiʻi to calculate percent of average values for the entire October through April wet season.
El Niño dryness in Hawaiʻi tends to be the strongest in January and February so it’s useful to just look at rainfall for these months so see how the different cases stack up against each other. The rainiest conditions occurred in the weak El Niño, weak La Niña, and ENSO-neutral events, with the ENSO-neutral being the wettest of the three. Looking at the January-February 2019 weak El Niño map, you can see why it’s such a tough forecast. Yes, El Niño conditions exist in the Pacific, so the simplified expectation is that Hawaiʻi will have a dry winter. But for weak El Niños, it’s really iffy at best! Once you get to strong and very strong El Niño events, January and February dryness in Hawaiʻi is not only intense, it is widespread. On both maps, most of the state is at or below 50 percent of average rainfall, and there are significant areas below 20 percent of average.


Same as the October through April percent of average maps but for just January and February when the El Niño rainfall signal is the strongest.
The current El Niño event recently reached the very strong category based on CPC’s RONI data. The guidance from CPC predicts dry conditions for the 2025-2026 Hawaiian Islands wet season. This is consistent with what happened during the most recent strong (2009-2010) and very strong events (2015-2016). I would not be surprised if we start to have significant drought impacts in the Hawaiian Islands heading into spring 2027, especially for areas with non-irrigated vegetation, residents on rainwater catchment systems, and anything dependent on surface water flow.