
The summer months are part of the May through September dry season in Hawaiʻi, especially for the west- and southwest-facing leeward slopes. Diamond Head and Punchbowl turn brown during this time of the year. Kīhei and Māʻalaea on Maui can go for many days without measurable rainfall. If you’re looking for a time when you don’t have to mow your lawn as frequently, this is it.
And then there’s the Kona slopes region on the Big Island. Specifically from Hualālai volcano southward along the west flank of Mauna Loa roughly to the border of the South Kona and Kaʻū Districts. Although it is considered to be a leeward area by local definition, its annual rainfall cycle is definitely not like the rest of the state. It is the only leeward area in the island chain with a distinct rainy season during the summer months. As noted in my July 18th and August 8th posts, this year has been no exception, with several gages along the Kona slopes logging well above average May through July totals, higher than even the Hilo area (!!). For example, the rain gage at Waiʻaha Stream near Hōlualoa recorded a May through July total of 32.61 inches, or 221 percent of average. The Hilo Airport gage had 13.64 inches for the same period (58 percent of average), and the normally rainier site at Waiākea Uka mauka from the airport had 21.91 inches (48 percent of average).
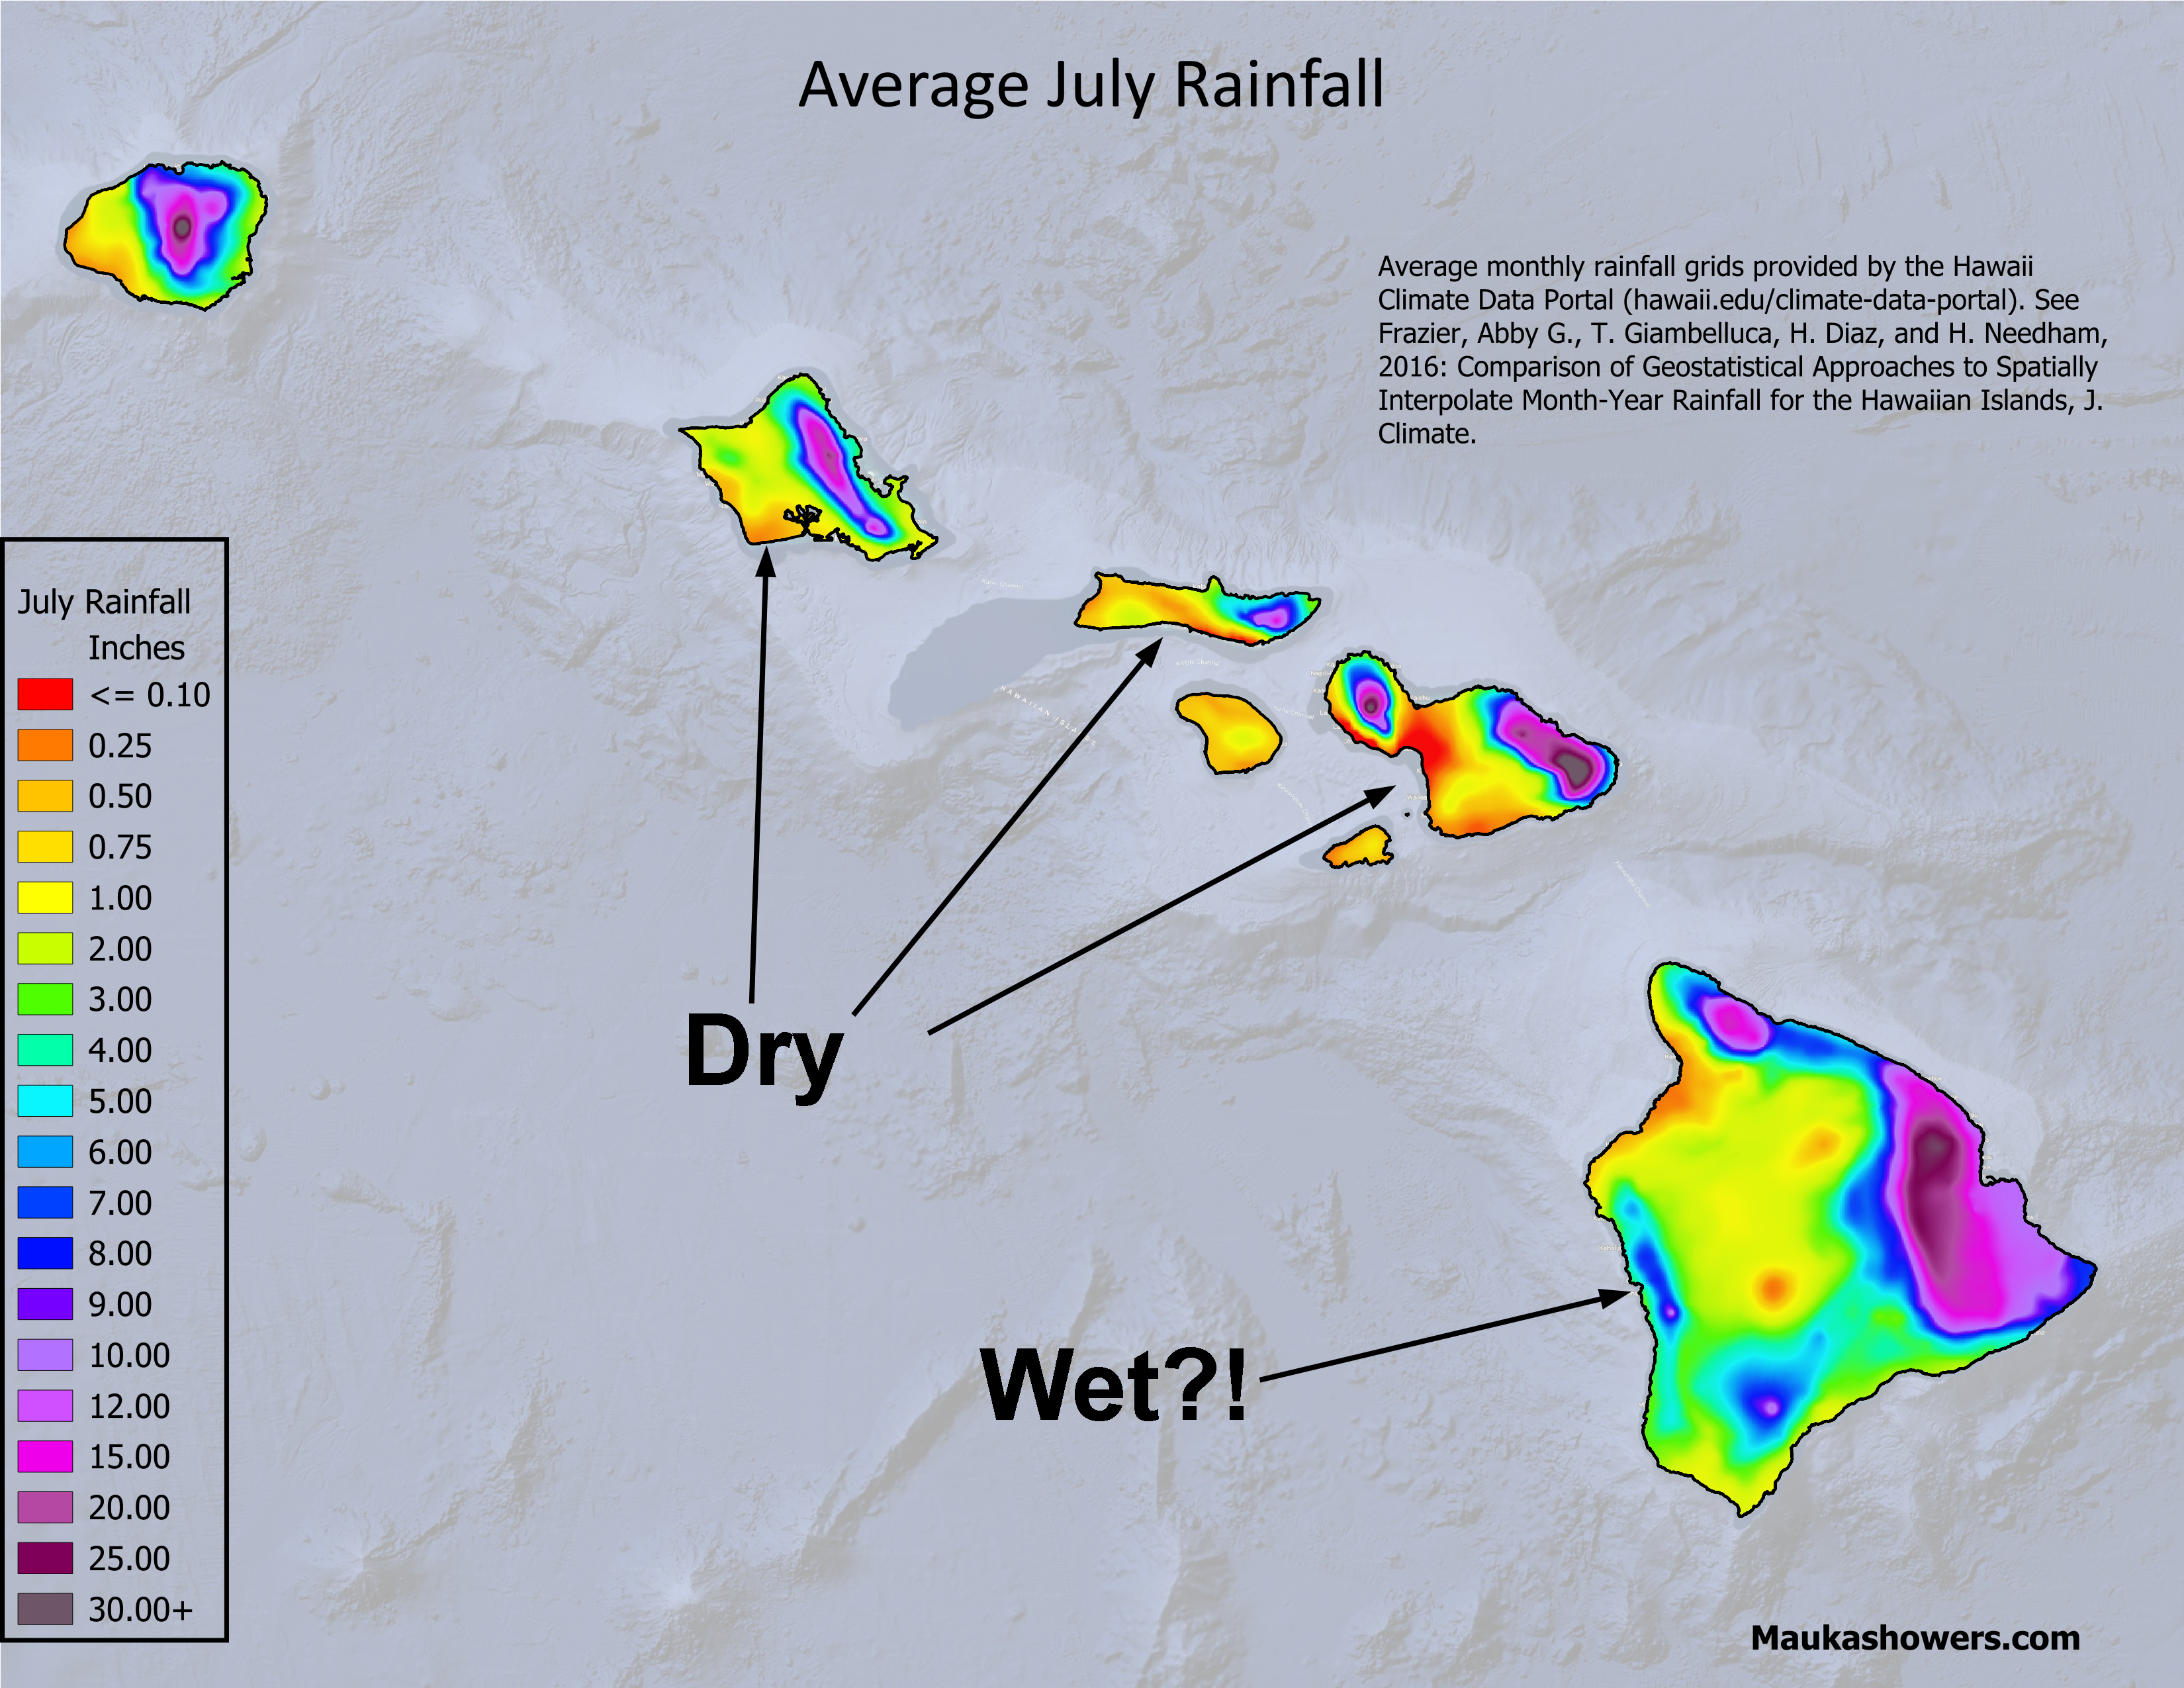
You can see this in the loop below of average monthly rainfall. As the months transition from winter to summer, notice how most of the leeward areas become increasingly yellow and orange as the totals decrease. Not Kona, though! The rainfall shading becomes bluer as the summer rainy season kicks in and rainfall totals increase. As the summer months transition to fall and winter, rainfall over the Kona slopes trends downward, while the leeward areas on the other islands have rainfall amounts increasing.

This loop shows monthly average rainfall across the state from the Hawaiʻi Climate Data Portal (HCDP). The red box at the start of the loop is the Kona slopes region with a distinct summer rainy season.
Looking at it another way, or if you’re not convinced by the color maps, the bar graphs below also clearly illustrate this. Starting off with the Kona slopes, let’s take a look at Waiʻaha Stream near Hōlualoa, and Kealakekua farther south. Both sites have their lowest monthly totals during the late fall and winter months, which are squarely within the Hawaiian Islands wet season. The monthly totals steadily rise to a peak in early summer, followed by a dip in August, and then a dry season maximum in September. It’s interesting how there’s a bimodal distribution in the monthly rainfall. I’ll be honest, I’m not completely sure what the cause of this twin peak signal is right now. Based on Convective Available Potential Energy (CAPE), which is a measure of atmospheric stability, the airmass around the Big Island is most unstable in September. This means you can potentially have more intense rainfall, but doesn’t explain everything. It also doesn’t jive with the dip in August, or the significant decrease in October rainfall, since both months have average CAPE values similar to September. Other things are in play, and it would be interesting to dig into this deeper.


Graphs of average monthly rainfall from Waiʻaha Stream near Hōlualoa and Kealakekua. The data are from the HCDP.
What about the leeward sites in other parts of the state? The graphs below are for Honolulu Airport (Daniel K. Inouye International Airport) and Mānā, on the leeward sides of Oʻahu and Kauaʻi, respectively. Both have significantly drier months during the summer, and much more rainfall during the fall and winter months.


Same as previous, except for Honolulu Airport and Mānā, Kauaʻi. Honolulu Airport averages are from the National Oceanic and Atmospheric Administration (NOAA).
The rainy season over the Kona slopes isn’t the same from year-to-year, or even from decade-to-decade. Large scale variations affecting the overall stability of the atmosphere and the temperature of the surrounding ocean play a role in determining how much rainfall is produced during a given rainy season. Even emissions (vog) from Kīlauea volcano can have an impact on rainfall totals by making the precipitation generation process less efficient (Zuo, et al. 2021). The following graph shows May through September rainfall totals from the rain gage at Hōnaunau from 1994 through 2024. Without assistance from alcoholic beverages, you can see cycles in the totals on roughly 10-year periods, and a general shift upward from around 2019. The large peak in 2015 is related to the very warm ocean temperatures around Hawaiʻi in association with the strong El Niño event developing across the Pacific that summer. However, El Niño and La Niña cycles don’t line up well with the rest of the totals. The upward shift after 2018 may be associated with the end of the Puʻuʻōʻō eruption on the flank of Kīlauea. The eruption pumped a lot of vog into the atmosphere for 35 years, and its cessation may have resulted in an uptick in rainfall. This is purely speculation and I’ll leave it to others much smarter than me to take a look at this. One basic check, of course, is to see if the shift is evident outside of the May through September period, but you would also have to account for the variability produced by wet season weather systems like cold fronts and kona lows. There’s always something to look at and I’m running out of time for this post! Excuses, excuses.

May through September rainfall totals from the rain gage at Hōnaunau from 1994 through 2024. The data are from the National Weather Service.
Reference
Zuo, T., A. D. Nugent, and G. Thompson, 2021: Volcanic aerosol impacts on Hawaiʻi Island rainfall. J. Atmos. Sci., 78, 2249-2264.
One response to “Kona Slopes Rainfall…Marching to a Different Beat”
[…] Portions of the Kona slopes have been wetter than normal, but this is their wet season after all (see my August 15, 2025 post). I also wouldn’t get too excited about the above average shading over the leeward Kohala slopes […]