A tropical cyclone named Kiko succumbed to the effects of strong vertical shear and became a post-tropical remnant low north of the island chain. We can now go back to our regularly scheduled programming. Because Kiko passed north of the state, we didn’t receive much wind or rain, and only got the warning level surf along the east-facing shores. This is not a complaint, by any means. I am surely grateful that we weren’t hit directly by a significant tropical cyclone!
In my August 29 post about Grouch Season, I talked about waiting for the August numbers to see if some notable records were broken. I have the numbers now, and Hilo Airport’s 1.52 inches for the month did indeed break the record for the lowest August rainfall total. The August numbers for Hilo Airport go back to 1950, and the previous record was 2.66 inches in 1971, so it wasn’t even close! The U.S. Geological Survey’s (USGS) rain gage on Mount Waiʻaleʻale, one of the wettest spots in the state, recorded just 12.73 inches, which was the lowest August total in a continuous record going back to 1968.
Līhuʻe Airport was also on track to break an all-time August record. Amazingly, the airport recorded 0.83 inches on August 31 so the total for the month ended up at 1.25 inches, well above the record of 0.44 inches in 2007. Elsewhere across the state, Honolulu Airport recorded just a trace of rainfall, which was the lowest August total since 1974. Kahului Airport ended up with its driest August since 2002.
As seen in the map below, the past couple of months have been rather dry over most of the state. Most leeward areas have been drier than the usual dry for this time of the year. You might notice some leeward anomalies with high percent of average shading. Portions of the Kona slopes have been wetter than normal, but this is their wet season after all (see my August 15, 2025 post). I also wouldn’t get too excited about the above average shading over the leeward Kohala slopes and coastal portions of leeward Haleakalā on Maui. These areas average less than an inch over July and August, so a decent day of rain, or even an hour of rain from a brief heavy shower can really skew the percentages. However, it’s the windward side of the Big Island that really sticks out like a desiccated thumb. This part of the state has received well below half of their average July and August rainfall. The images below help illustrate the point. Vegetation along the north wall of Waipiʻo Valley on August 11 has turned gray due to the prolonged lack of rain. The second image shows the same area (taken from a slightly different location) from February 2014, which was also an anomalously dry period, but not nearly as dry as this summer. The annotated areas were in much better shape back then.

Percent of average rainfall for July and August 2025 across the main Hawaiian Islands. Rainfall data are from NOAA and the Hawaiʻi Climate Data Portal (HCDP). Average rainfall values are also from the HCDP.

Image of Waipiʻo Valley in the Hāmākua District of the Big Island. Vegetation along the north wall of the valley is very dry. The image has been cropped to more closely match the area of the February 2014 image below. Photo credit: Derek Wroe.

Image of Waipiʻo Valley taken in February 2014. The picture was taken at a slightly different spot from the previous image, but you can still see the same areas of the north wall in the valley. Photo credit: Me
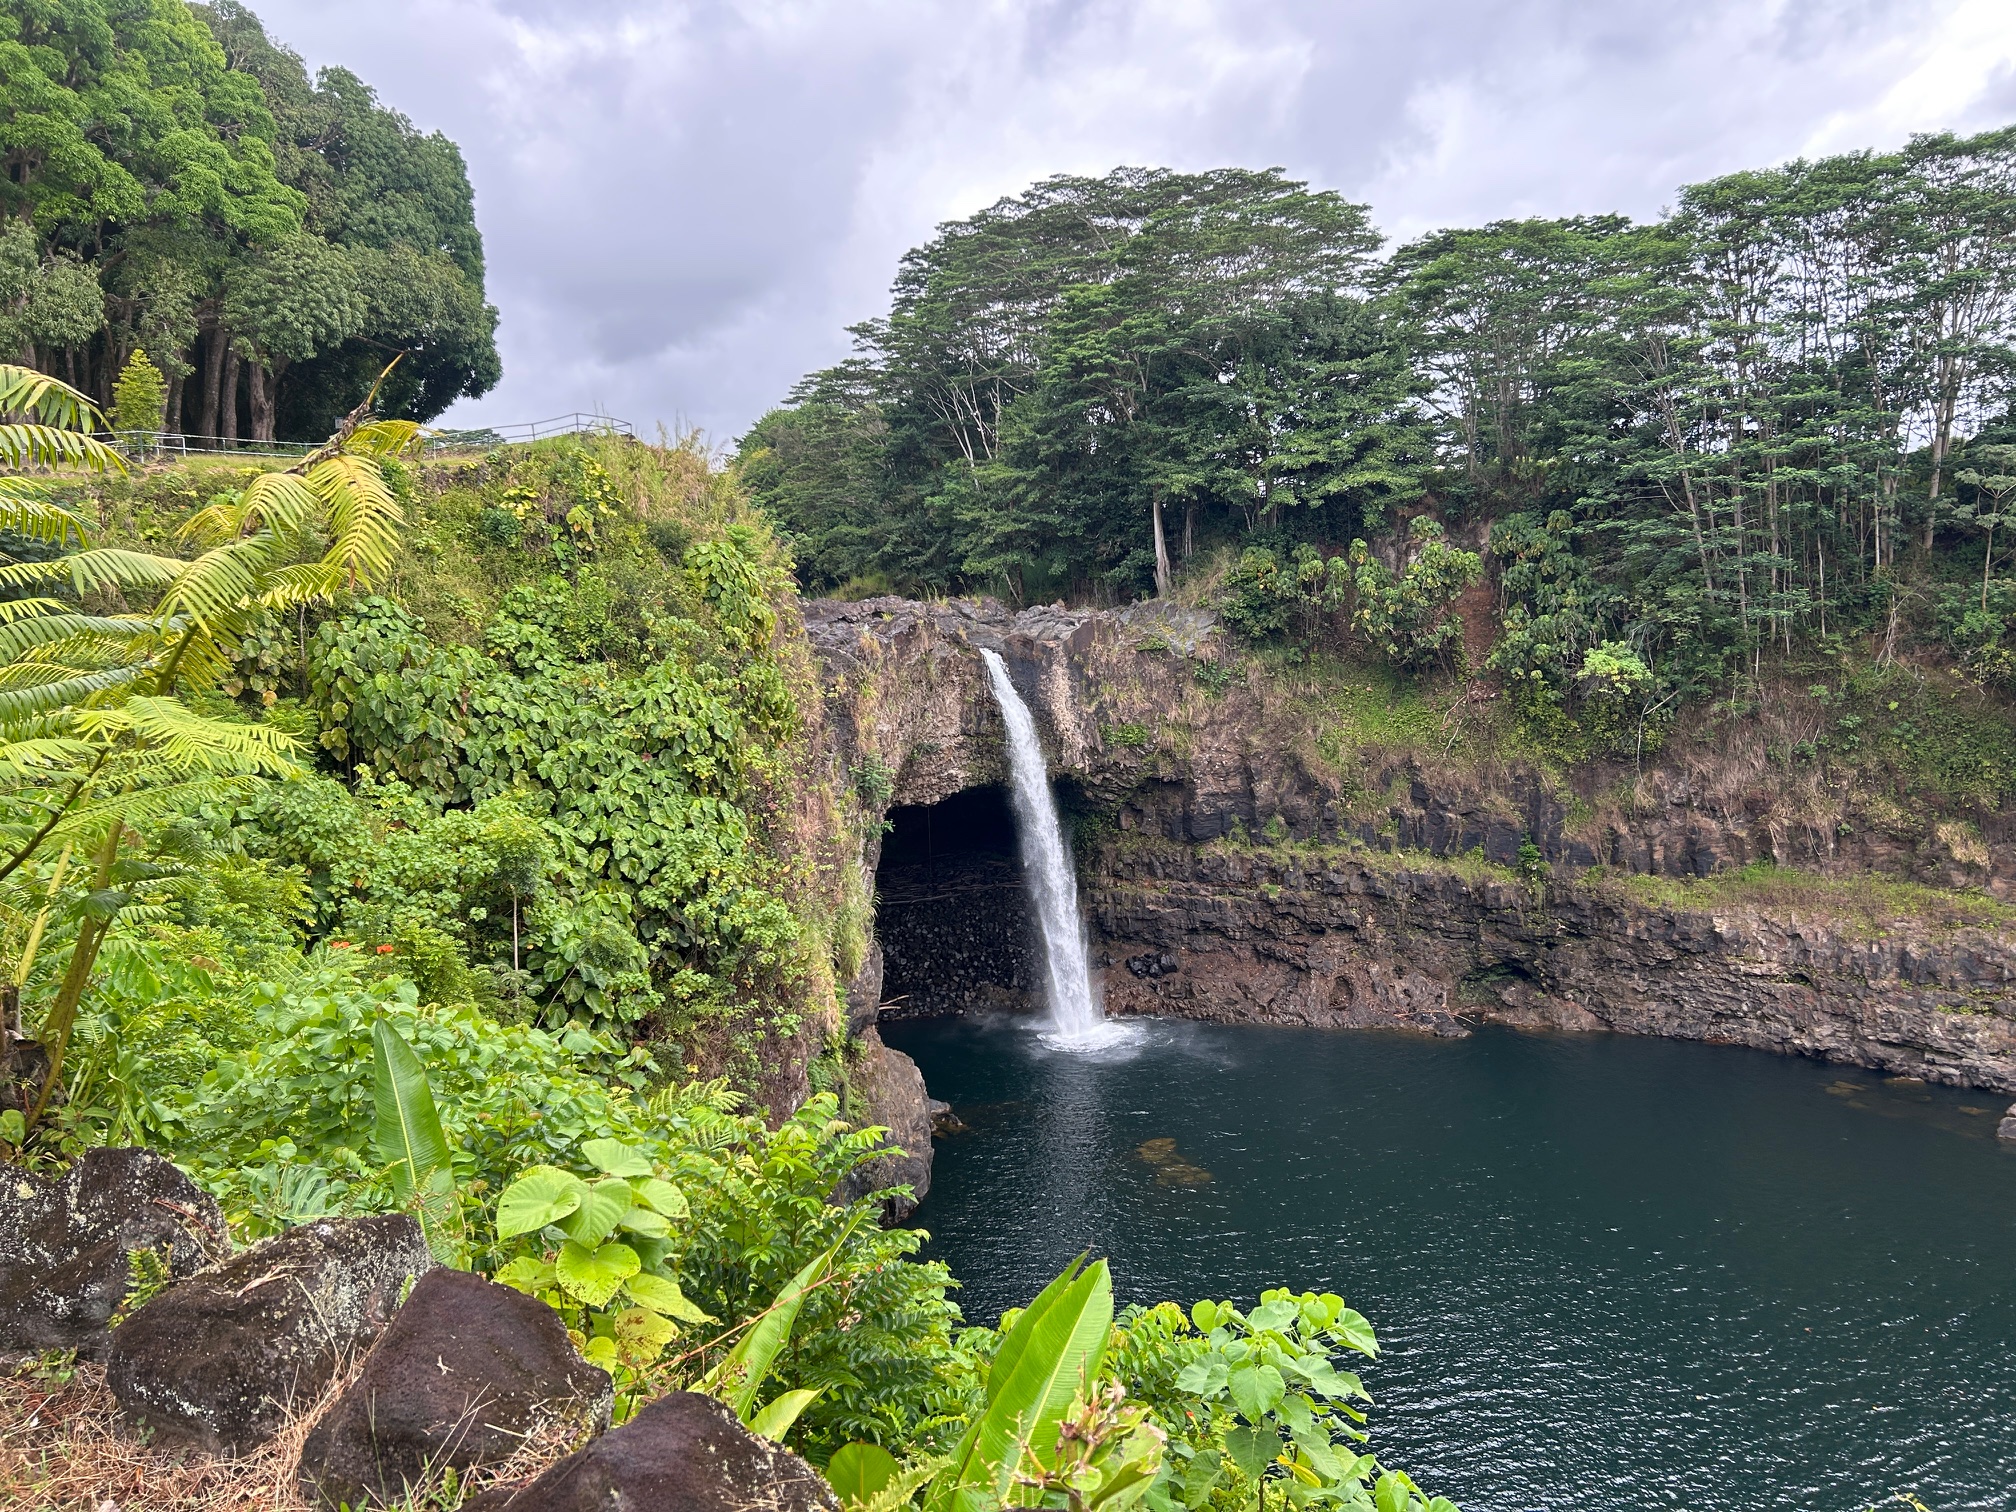
Looking at the 28-day streamflow values from the USGS as of September 11, it’s readily apparent that we’re in a significant hydrologic drought. It’s not often that you see so many stream gages classified as “Low” and “Much below normal” on their map. Wailuku River on the windward side of the Big Island is one of the “Low” flow sites. Rainbow Falls is on Wailuku River and the image from August 29 shows a rather small amount of flow. A lot more water is needed over the falls to kick up enough mist for a decent rainbow!

Map of 28-day average streamflow as of September 11, 2025 from USGS gages across the state. Percentile classes are listed at the bottom.

Rainbow Falls in Hilo on August 29. Photo credit: My son.
Summer drought in Hawaiʻi can affect the leeward and windward sides in very different ways. Over the leeward areas (except the Kona slopes), drought is much more “in your face”. It’s a normally dry time of the year anyway, but you end up with even drier conditions with little or no rain for long periods of time. Windward drought in the summer hits differently. With persistent trades, you still have roughly the normal amount of days with rain, but it’s the amount per day that can be a lot less. This can lead you to believe that things are okay because, hey, it’s still raining like almost everyday. But then you start noticing that the vegetation is drying out. Or you don’t have to mow your lawn as much. Or your catchment tanks aren’t filling up as usual. Or brush fires are starting to break out, like they have been recently along the Hāmākua District of the Big Island.
To help illustrate this point with data, the graphs below show July (first graph) and August (second graph) rainfall totals at Hilo Airport from 1990 through 2025. I’ve also included the number of days in the month with measurable rainfall (at least 0.01 inches). The July and August averages for the data period are marked by the bold horizontal red line. Notice that both July and August show very little change in the number of days with rain. You can have rain almost every day of the month but still have a well below average total, resulting in drought conditions. August 2025 is an outlier both in terms of the monthly total and the number of rain days. The large rainfall total in August 2018 is from Hurricane Lane.

Graph showing Hilo Airport July rainfall totals (blue bars) and number of rain days (at least 0.01 inches) in the month (gray bars) from 1990 through 2025. The red horizontal line is the average July rainfall for the data period shown. The graph is based on data from XmACIS.

Same as above, except for August.
Something else is worth watching in the Hilo Airport data. The figure below is a “Haywood graph” of accumulated rainfall at Hilo Airport. A Haywood rainfall graph plots the running accumulation through the year and includes many years of data. It provides a convenient way to look at how your current rainfall compares with other years. The accumulated rainfall for 2025 is the blue line in the graph and shows Hilo Airport is on pace to have its lowest annual rainfall total on record. I’ve annotated a math equation in red to show how it rates on an urgency scale. The current record of 63.32 inches was set in 2010. Hilo Airport recorded 35.48 inches in 2025 through the end of August, and another 1.45 inches through September 11. This means the airport will need to receive another 26.39 inches from September 12 through the end of the year to avoid breaking the record. Hilo being Hilo, it’s easily within the realm of possibility to have this much rainfall over the rest of 2025, but it will be interesting to watch it play out over the next few months.

Edited Haywood graph of accumulated rainfall from January 1 through August 31 at Hilo Airport. The blue line shows the rainfall for 2025. Green-ish lines are the 5 wettest years and the yellow and orange-ish lines are the 5 driest years. The gray lines are the remaining years in the period of record going back to 1950. Hilo Airport data actually go back to 1949, but the first full year of data was 1950. The bold black line is the average accumulated rainfall. The graph is from the NOAA National Centers for Environmental Information. The edits in red are my own.