
I hate August and September. That’s it. That’s the blog post.
But since you asked…the reason why I hate August and September is because these two months are the hottest of the year, and I’m definitely not fond of heat and humidity. It boosts my grouch factor quite a bit and makes me impatient for the cool season. Don’t get me wrong, I’m not a fan of bitterly cold temperatures either. I lived in North Dakota for several years, and being below zero Fahrenheit continuously for two weeks wasn’t particularly thrilling. But at least with cold, you can add layers of clothes when going outside. When it’s hot, there’s only so much you can take off without attracting a lot of unfavorable attention.
You might also be wondering (but probably not) why I’m not covering the windward Big Island annual rainfall cycle and drought like I said I would last week. The reason is because it’s so close to the end of the month, I figured I may as well wait one more week so that I can include the August totals in the discussion. We’re also on pace to have record low August rainfall at Hilo Airport and Līhuʻe Airport, and the lowest August rainfall total in over 50 years at Honolulu Airport, so I want to see if these notable items come to pass. But back to Grouch Season.
Looking at the average maximum temperatures by month, you can see that the highest values at the four main climate sites in the state are in August or September. Although it’s currently well past the summer solstice and the days are getting shorter, temperatures in Hawaiʻi still increase heading toward the autumnal equinox.

Monthly average maximum temperatures at the four main climate sites in the State of Hawaiʻi. The data are from the National Centers for Environmental Information (NCEI) and are computed for the period from 1991 through 2020.
The main reason our warmest months occur in late summer is because our temperatures are highly influenced by the ocean temperatures, and the ocean maximum (and minimum) temperatures lag the solar cycle by a few months. The graph below compares average monthly sea surface temperature (SST) data from Buoy 51001 northwest of Kauaʻi, and the average monthly air temperature at Līhuʻe Airport. The general shape of the temperature curves are very similar, with a more gradual rise in the spring and summer, followed by a sharper drop in the fall. The Līhuʻe Airport temperature peaks in August but the Buoy 51001 SST actually continues rising slightly into September by a few tenths of a degree. The loop below the graph shows monthly average SST values around the state so you can see the same trends spatially.

Graphs of the average monthly SST values (degrees Fahrenheit) and the average monthly air temperature at Līhuʻe Airport (also degrees Fahrenheit). The buoy data are from the NOAA National Data Buoy Center (NDBC). The Līhuʻe Airport data are from NCEI.

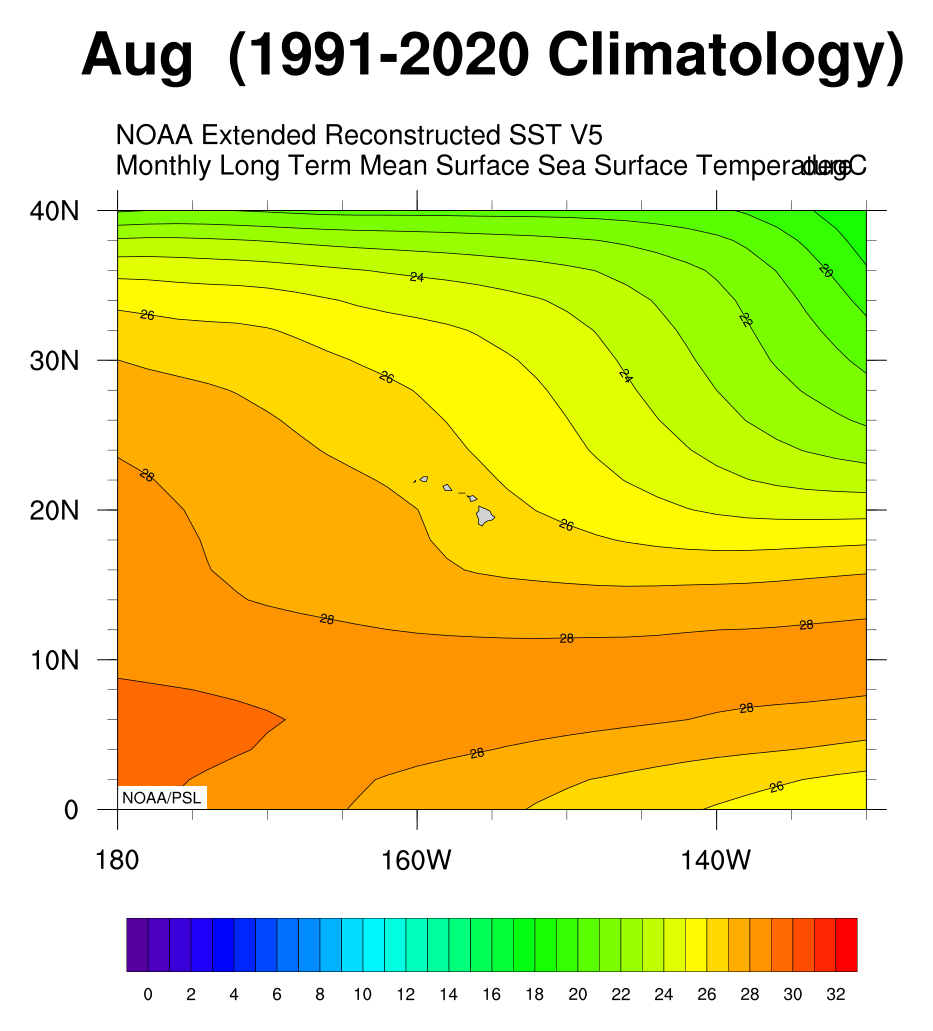
Loop of long term (1991-2020) monthly mean SST values in the central North Pacific centered on the main Hawaiian Islands. Temperatures are in degrees Celsius. A temperature of 24 degrees C is about 75 degrees F, and 26 degrees C is close to 79 degrees F. The data and graphics are from the NOAA Physical Sciences Lab.
How does this compare with the annual cycle of temperatures for a location not surrounded by the ocean? Let’s use Kansas City, MO as an example, not because I’m a Chiefs fan (Seahawks fan here), but because it’s pretty close to the middle of the CONUS, surrounded by nothing but land. The chart below compares the average monthly maximum temperatures for Kansas City and Honolulu Airport. At Kansas City, the hottest month of the year is July, just after the summer solstice, and a month earlier than Honolulu. By September, Kansas City is definitely starting to cool off, while we’re still sweltering in near peak temperatures because our surrounding ocean is still at peak warmth for the year.

Graphs showing the average monthly maximum temperatures for Honolulu Airport (red) and Kansas City (blue). Data are from NCEI as in the graphs above. The Kansas City graph has been intentionally plotted in blue because it’s not the Chiefs’ color.
What about someplace where the average SST values don’t change much throughout the year? A location like this would be Majuro Atoll far southwest of the Hawaiian Islands, near 07 degree north latitude, 171 degrees east longitude. The average monthly SST values have only a couple of degrees Fahrenheit difference between their warmest and “coolest” months. Majuro’s length of day also varies by less than an hour between the summer and winter solstice, and doesn’t have any cooler airmasses from cold fronts as far as I’m aware. As you can see from the graph below, Majuro’s temperatures don’t change much throughout the year, with no appreciable “summer” and “winter”. Their seasonal changes are likely felt more by the changes in rainfall as the Intertropical Convergence Zone (ITCZ) shifts across their area.

Average monthly maximum temperatures for Honolulu Airport (red) and Majuro Atoll (blue). Data are from NCEI as above.
I guess that was a long explanation of why August and September are my least favorite months of the year. When someone asks me in August, “hey, it’s so hot, when is it going to cool down?”, my answer is always “November”. They think I’m joking, because that’s like forever days away, but I say it with a straight face. Now you have the data and can see why. So if you talk to me and it seems like I’m in a bad mood, it’s not you, and it’s nothing personal. It’s just Grouch Season.
One response to “It’s Grouch Season”
[…] my August 29 post about Grouch Season, I talked about waiting for the August numbers to see if some notable records […]