
Note: This blog post will NOT be updated with the latest position and forecast information regarding Kiko. For the latest official tropical cyclone forecasts, watches, and warnings, please go to hurricanes.gov. For the latest information on local weather, water, and marine impacts from Kiko, please go to the Honolulu Forecast Office website.
Based on the title of this post and the note above, yes, a significant tropical cyclone named Kiko is approaching the main Hawaiian Islands. As of 11 AM HST on Friday, September 5, Hurricane Kiko was about 1195 miles east-southeast of Hilo. This tropical cyclone developed in the far eastern Pacific, with the National Hurricane Center (NHC) issuing its first advisory for Tropical Depression 11-E at 8 PM HST on August 30. Just six hours later, NHC upgraded the cyclone to Tropical Storm Kiko as it became better organized.
Backtracking further in time, NHC was actually watching for Kiko’s potential development as early as August 24 when they first mentioned it in their Tropical Weather Outlook. At this point in time, only the global weather models indicated that a tropical cyclone could develop within the next several days. By the morning of August 27, satellite images were showing signs of possible development in the thunderstorm activity pattern and NHC initiated an “invest” area (93E) to watch it further. For more information on “invest”’ areas, check out my post from August 1. The loop below shows Invest 93E on the morning of August 30, about 9 hours before NHC initiated advisories on the system. Thunderstorms around the low level center are becoming better organized.

NOAA/NESDIS GOES-18 infrared (IR) image loop showing Invest 93E on the morning of August 30, 2025. Yellow/orange/red/black colors show the coldest (and highest) cloud tops from thunderstorm activity. Lighter gray shades are low clouds, and the darker gray areas are the ocean or land areas.
Kiko steadily strengthened and on the morning of September 1 was a rather healthy tropical storm with maximum sustained winds of 55 knots (65 mph). The loop below shows thunderstorms wrapped counter-clockwise near and around the low level center of the cyclone. Just 12 hours later, NHC declared Kiko to be a hurricane (Category 1 on the Saffir-Simpson Hurricane Wind Scale) with maximum sustained winds of 65 knots (75 mph).

Same as above, except for the morning of September 1, 2025.
On the night of September 2, Kiko intensified rapidly, reaching Category 4 on the afternoon of September 3 with maximum sustained winds of 125 knots (145 mph). Considering the warmth of the ocean beneath the cyclone and the weak vertical wind shear, this amount of intensification was not surprising. The dark orange, red, and black colors around the eye of the hurricane indicate very cold (and high) cloud tops. The very cold cloud tops, combined with a cloud-free eye, are indicators of an intense tropical cyclone. While you don’t need to have an eye in the visible sector or IR images to have a hurricane, cloud-filled eyes are generally indicators of a less intense system than a cloud-free eye.

Same as above, except for the morning of September 3, 2025 as Kiko rapidly intensified.
Fast forward to this morning (Friday, September 5), and you can see in the loop below that Kiko is still a major hurricane. Its eye became cloudy overnight, but is in the process of clearing out once again, indicating that Kiko has started to intensify once again. Strong hurricanes such as Kiko can go through fluctuations in intensity as it goes through eyewall replacement cycles. These cycles are difficult to anticipate and is one of the issues that make the intensity predictions challenging for forecasters.

Same as above, except for September 5, 2025, and zoomed in and centered on Hurricane Kiko. The zoomed in view provides a better look at the eye clearing out as Kiko restrengthens.
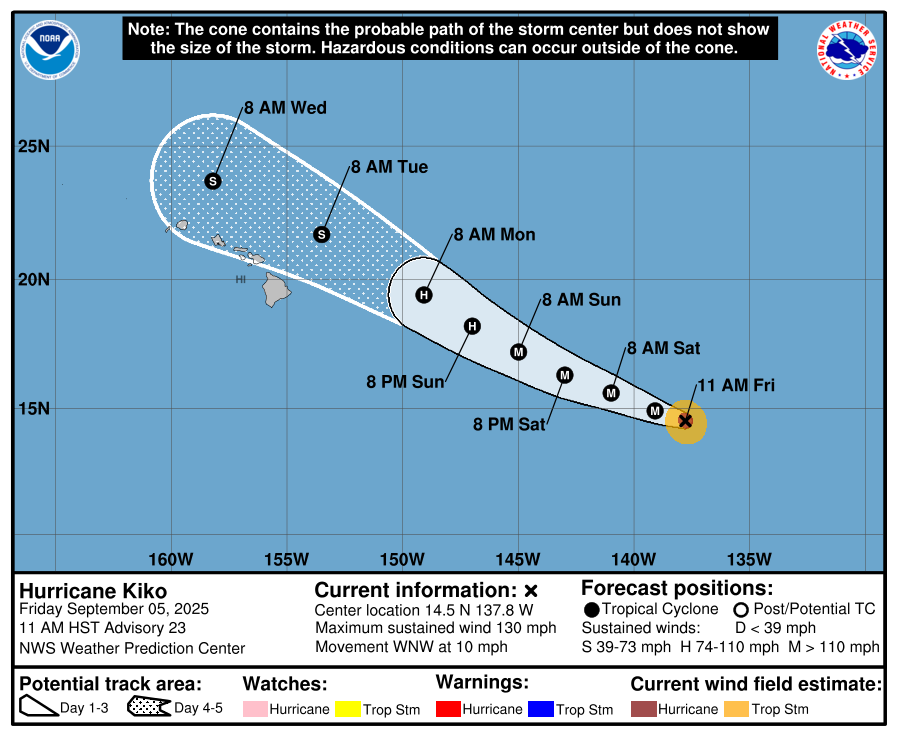
You may be wondering what this all means for anyone on the main Hawaiian Islands. I’ve included the 5-day forecast track from 11 AM HST, September 5 issued by NHC. Most of you are probably familiar with this graphic, or something very similar. The black dots show the center positions at various times over the next five days. They indicate, based on numerical model inputs, experience, and other factors, where the forecaster thinks the center of the tropical cyclone will be. The forecast track shows that the center of Kiko is likely to pass north of the island chain next week Tuesday and Wednesday with an intensity at tropical storm level.

Tropical cyclone forecast cone graphic issued at 11 AM HST by the National Hurricane Center. Dots are forecasted center positions over the next five days. The solid and stippled white areas indicate the error cone. These graphics are routinely issued every six hours at 5 AM, 11 AM, 5 PM, and 11 PM HST when there is an active tropical cyclone.
The modern day track forecasts are very good, and continue to improve over time. However, all forecasts have errors. Because of this, an error cone is also plotted on the graphic and is shaded in white for the next three days, and stippled white for days four and five. The error cone is based on the running 5-year track forecast verification for the tropical cyclone basin and encloses roughly two-thirds of the errors in the center forecasts. This means that most of the time, the center of the tropical cyclone falls within the cone over the next five days. It also means one-third of the time, the center falls outside the cone! As a result, the 11 AM forecast tells me that although the center of Kiko should pass north of the state, we are not entirely safe yet! Due to changes in the large-scale environmental conditions, as well as changes in the cyclone’s structure and intensity, the forecast could still easily shift southward over the next few days so it’s important to keep checking for the latest updates. Don’t hang your hat on any particular forecast because it WILL change over time!
Another consideration is that strong winds extend outward from the center of the cyclone, and the cone graphic doesn’t depict the wind field forecast. Because of this, I also look at the probability graphics, which are issued with every routine tropical cyclone forecast package (at 5 AM, 11 AM, 5 PM, and 11 PM HST). Probability graphics, which account for forecast error and the wind field, are available for tropical storm force (>= 34 knots, or 39 mph), 50 knots (60 mph), and hurricane force (>= 64 knots, or 74 mph).
A third graphic you can look at is the Arrival Time of Winds. These are particularly useful for determining how much time you have to prepare. Depending on your risk tolerance, you can look at the “most likely” arrival time for tropical storm force winds or the “earliest reasonable” arrival time (1 in 10 chance).
While I’ve been focusing on the winds so far, don’t forget that tropical cyclones also produce heavy rainfall and flash flooding, as well as high surf and storm surge. Both of these hazards can occur even though the center misses the islands!
Over the years that I worked at the Honolulu Forecast Office and the Central Pacific Hurricane Center, I’ve occasionally heard the myth that the Big Island will deflect a tropical cyclone coming in from the east. This is entirely untrue. As the graphic below shows, in recent years the Big Island has been hit directly twice by tropical storms (Iselle in 2014, Darby in 2016), and Maui has been hit once by a tropical storm (Olivia in 2018). In fact, Iselle and Darby made landfall within 10 miles of each other, which tells me that someone on the Kaʻū coast was surely doing the wrong dance! In all three cases, the tropical cyclones were significantly affected by the islands but survived the encounters to live for a few more days. For Iselle and Darby, it was like running over a huge speed bump and getting some flat tires, but they still kept going. Darby also subsequently produced intense rainfall over Honolulu and significant flash flooding.

Track graphic of recent tropical cyclones where the center directly hit the Hawaiian Islands. Data for the graphic are from the International Best Track Archive for Climate Stewardship (IBTrACS) database hosted by the NOAA National Centers for Environmental Information (NCEI).
While the latest forecast is encouraging, I’m still watching Kiko very closely. Since hope is not a plan, I’m making preparations as appropriate for this time frame. At the top of this blog post, I included some links so you can get the latest forecast information from the National Hurricane Center and the Honolulu Forecast Office. If you’re looking for planning and preparedness information, here are some links you may find useful:
- Hawaiʻi Emergency Management Agency (HIEMA): HIEMA’s website contains a wealth of preparedness information not just for tropical cyclones, but many natural hazards.
- County Emergency Management Agencies: Your respective county emergency management offices will have specific information affecting your county, including availability and status of evacuation shelters.
Be prepared and stay safe!