
In my very first blog post on July 18, recall that I talked about how the East Pacific tropical cyclone basin quickly went through six named systems by late June but was going through a lull in activity since then. About a week prior to that post, the eastern and central Pacific tropical basins looked like this.

NOAA/NESDIS GOES-18 infrared (IR) image loop covering the tropical central and east Pacific on the morning of July 12, 2025. Yellow/orange/red colors show the coldest (and highest) cloud tops from thunderstorm activity. Lighter gray shades are low clouds, and the darker gray areas are the ocean or land areas. The Intertropical Convergence Zone (ITCZ) south and southeast of Hawaiʻi had very little thunderstorm activity.
Over the next week, thunderstorm activity picked up considerably, as seen in this IR satellite loop from July 23. Note how there’s a lot of thunderstorm activity in the ITCZ. My wife would say, “all I see is a bunch of yellow, orange, red, and black stuff below Hawaiʻi”. That’s the point! The yellows, oranges, reds, and blacks are the areas thunderstorms, and it’s much more active compared to the previous image.

Same as above, except for July 23.
These periods of active and suppressed thunderstorm activity are not uncommon, and there are several intraseasonal features that can cause this type of modulation. One of the big ones is the Madden-Julian Oscillation (MJO), which has been tied to cycles of tropical cyclone activity. Several years ago, the climate.gov’s blog did a nice job covering the basics of the MJO. You can check it out here. NOAA’s Climate Prediction Center (CPC) tracks the MJO and provides weekly updates on its progress. In their July 28 update, CPC mentioned that a “coherent MJO” had been moving across the Pacific since mid-July.
By July 25, thunderstorm activity focused mainly in the portion of the ITCZ far southeast of the Big Island. While the coldest cloud tops were not as widespread as before, several low level disturbances embedded within the ITCZ had the potential to focus thunderstorm development. One of these areas was designated “Invest 97E” by the National Hurricane Center. The term “Invest 97E” doesn’t refer to a financial instrument, but rather identifies an area for closer investigation and monitoring by tropical cyclone forecasters. All “invest” areas have an ID number in the 90s, and a letter indicating the tropical cyclone basin in which it is located. The central Pacific basin uses the letter C and the east Pacific uses E. Weather models indicated that Invest 97E had the potential to organize further and become a tropical cyclone.

Same as previous GOES loops, except for July 25.
Thunderstorms near the center of the “invest” area became more widespread and better organized over the next day. On the night of July 26, the National Hurricane Center (NHC) began issuing advisories on Tropical Depression 01C (TD-01C), dropping the “invest” designation. At this time, NHC estimated its maximum sustained winds to be 35 mph (30 knots). In the loop below, thunderstorms associated with the newly formed depression are the orange and black areas in the center-left. The area in the upper right is another developing tropical disturbance. More on this in a bit. On Sunday, TD-01C continued to intensify and was declared to be Tropical Storm Iona, the first named tropical cyclone for the Central Pacific basin in 2025.
Note: “Iona” is pronounced “ee-OH-nah”. It’s not “eye-OH-nah”. That would be spelled “Aiona”, as in “I own a car from Aiona Car Sales”. Hilo people know what I’m referring to.

Zoomed in GOES IR loop produced by Tropicaltidbits.com. The loop covers the period from 0625-0845 UTC, July 27 (8:25pm – 10:45 PM, July 26, HST).
On the morning of Monday, July 28, the first weather thing I looked at was the tropical Pacific satellite image loop. Iona looked obviously stronger, but what also caught my eye was another blob of cyclonically rotating (counter-clockwise in the northern hemisphere) clouds to the northeast of Iona. I checked hurricanes.gov and, sure enough, NHC started issuing advisories on the system at 5 AM HST, designating it Tropical Depression 02C (TD-02C). Iona had also been upgraded to a hurricane. Just six hours later, TD-02C was upgraded to Tropical Storm Keli. There are three interesting things to point out here. One was the small size of TD-02C/TS Keli, which was only about the size of the Big Island. The second was having two tropical cyclones at the same time in the Central Pacific basin (north of the Equator, between 140W longitude and the International Dateline). Usually it’s just one at a time. And third was its close proximity to Iona. Tropical cyclones usually develop with much larger spacing from each other. In this case, it looked like Iona had a smaller sibling tagging along on its adventures. Both systems were far from the main Hawaiian Islands. In more familiar terms, both were farther away from the Big Island than two Hilo to Honolulu flights. Enough time for multiple POG (passion-orange-guava, for you non-locals) drinks, or sipping one slowly instead of downing it in one gulp before the flight attendant comes to pick up your trash.

NOAA/NESDIS IR loops showing Iona and Keli on the morning of July 28.
As if things weren’t interesting enough, it got even better with Iona. The hurricane rapidly intensified on July 28, and reached major hurricane status at 11 PM that night. At 2 AM HST, July 29, NHC estimated Iona’s maximum sustained winds to be at 110 knots (~125 mph), or a 50 knot increase over 24 hours!! Whaaatt??!! Keli was also moving along, but its development was possibly hindered by its small size and close proximity to Iona.

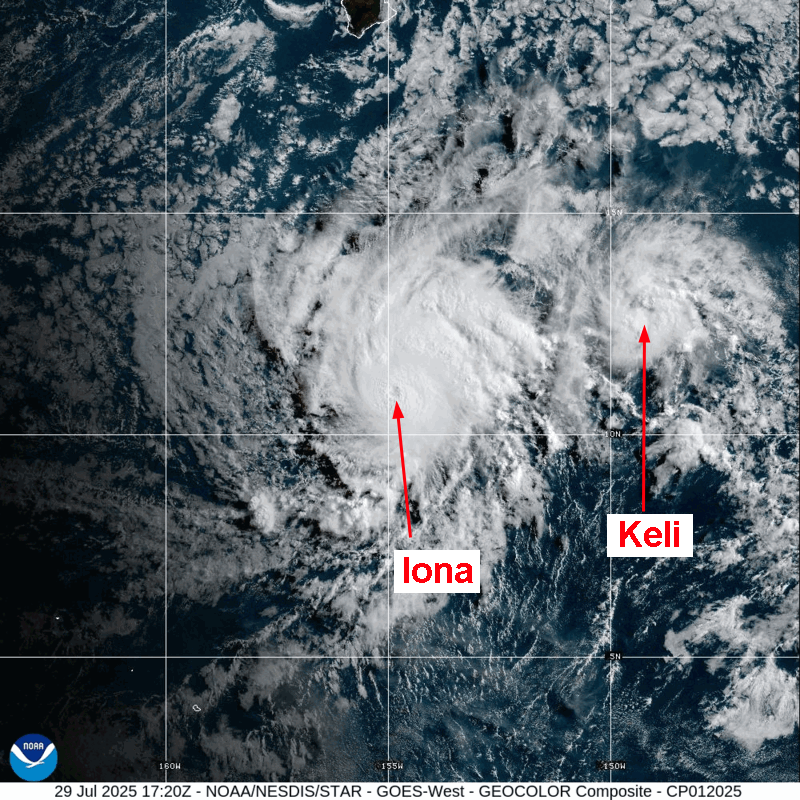
NOAA/NESDIS IR image loop from the early morning hours of July 29 centered on Major Hurricane Iona. The Big Island is in the upper center of the images, and Tropical Storm Keli is east-northeast of Iona.
The rapid intensification of Iona was impressive. Nearly as impressive was how fast Iona weakened. Shortly after reaching 110 knots of maximum sustained winds, environmental conditions unfavorable for maintaining a healthy tropical cyclone began to significantly affect the cyclone. At 2 AM HST, July 30, Iona’s intensity was down to 70 knots, or a decrease of 40 knots in 24-hours, and at 11 AM, NHC downgraded Iona to a tropical storm status. The combined IR and visible sector loop below, nearly centered on Iona, shows a fully exposed low-level circulation center and significant thunderstorms separated well to the east. This type of satellite image pattern is indicative of a struggling tropical cyclone. TS Keli, still to the northeast of Iona, is also struggling to remain organized. By midday on July 30, NHC declared Keli to be a dissipated system when its low level circulation center opened up to a low pressure trough. On the night of July 30, thunderstorm activity near the center of Iona flared up again. It was enough to keep the cyclone at tropical storm strength, but strong vertical shear (change in winds with height) prevented the regeneration of a healthy core. As I write this post on August 1, TS Iona is approaching the International Dateline and is still trying to remain viable with poorly organized bursts of thunderstorms near its center.

NOAA/NESDIS combined IR and visible sector loop showing the low-level circulation center of Iona just left of image center. The Big Island is in the upper right, and TS Keli is in the right-center to the south of the Big Island and northeast of Iona.
This has been an interesting initiation of tropical cyclone activity for the Central Pacific basin. What we often see is the first system struggling to make it to 140W and dying just after crossing the basin boundary. We don’t typically expect the first tropical cyclone to go through 50 knots of rapid intensification and reach major hurricane status!
In terms of numbers, the onset of activity in July falls within the norms of the season. The graph below shows that although the official Central Pacific tropical cyclone season starts on June 1, we usually don’t see our first system until July. Activity peaks in August, then falls off quickly in September and October. However, don’t sleep on late season systems! Remember that Hurricane Iwa hit Kauaʻi in late November 1982.

3 responses to “Central Pacific Hurricane Basin Lights Up”
[…] an “invest” area (93E) to watch it further. For more information on “invest”’ areas, check out my post from August 1. The loop below shows Invest 93E on the morning of August 30, about 9 hours before NHC initiated […]
[…] big contributor, though, is the increase in tropical cyclone activity, which I also covered in my August 1 post. Direct tropical cyclone impacts over the state don’t happen too often, but you don’t need a […]
[…] developed in the CNP during an active phase of the Madden-Julian Oscillation (MJO). Check out my August 1 blog post for more details on the formation and development of Iona and Keli. Henriette and Kiko moved into […]