
I’ll start by saying that what I saw on Sunday was a level of destruction I haven’t seen in a while. The weather was pretty destructive too! The utter dismantling of the new england patriots by the Seattle Seahawk’s defense was glorious. Due to a power outage at my place, I had to watch the first half on my phone using the Spectrum TV app. It was a bit laggy, but it worked. Fortunately, our power came back on for the second half. I was lucky. I was able to watch the game without my roof coming apart or having a tree come down and damage my house or car. My neighbor had some banana trees snapped but that was the worst of it. Others were not so lucky.
Last week Friday, a cold front reached Kauaʻi and moved eastward down the chain before stalling and dissipating near the Big Island on Saturday. A low pressure system aloft subsequently dropped into the area west of main Hawaiian Islands to help create unstable conditions over the cold front remnant and its associated moisture. The surface analysis map below shows the cold front just past Kauaʻi at 2 AM HST Saturday, February 7. The high pressure system trailing the front to the northwest will also play a prominent role in weather conditions across the state over the following days.

Surface analysis from 2 AM HST, February 7, 2026, posted by the Honolulu Forecast Office (HFO). The line near Kauaʻi (lower right) with blue triangles marks the position of a cold front.
Heavy rainfall from the event started over the windward Hāmākua slopes of the Big Island on the evening of February 7. Intense rain cores affected the area near Waipiʻo Valley, Honokaʻa and Paʻauilo but fortunately didn’t last long. This burst of rain produced the peak observed rain rates for the entire state during the event. Conditions would only get worse from here.
By the morning of Sunday, February 8, the surface high pressure system strengthened and shifted east with a center position several hundred miles north of Oʻahu. The resulting strong pressure gradient over the state produced high winds that would persist for several days. Concurrently, the previously mentioned low pressure system aloft began to dig southward to the west of Kauaʻi (see satellite image loop below). The presence of the trough aloft combined with the strong trade winds and the moisture from the remnant frontal band greatly enhanced the rainfall over the windward slopes of Maui and the Big Island on February 8th and 9th.

NOAA/NESDIS GOES-18 color enhanced infrared (IR) image loop covering the tropical central and east Pacific on the morning of February 8, 2026. In this enhancement curve, blue, green, yellow, and orange colors show the coldest (and highest) cloud tops. Lighter gray shades are low clouds, and the darker gray areas are the ocean or land areas. Annotations in red (for the main Hawaiian Islands) and yellow in the first frame are my own.
Rainfall totals from the event were impressive, especially along the windward slopes of Maui and the Big Island. The 4-day accumulated rainfall analyzed by the Multi-Radar, Multi-Sensor (MRMS) system (image below) showed the highest amounts confined to the windward slopes with little focused rainfall over the ocean and leeward areas. To me, this suggests that this was primarily a terrain forced rain event that was strongly enhanced by a combination of persistent strong trades, left over moisture from the cold front, and unstable conditions aloft. In other words, windward and mauka showers on steroids. If enhanced rainfall was forced more by the low aloft, I think you would have seen more rainfall bullseyes/maxima over the open ocean or over some of the leeward areas of the island chain.

MRMS 4-day accumulated precipitation covering the period from February 7th through February 10th. The data in this graphic were downloaded from the MRMS repository on the Registry of Open Data on AWS and processed using QGIS software.
It appears that the MRMS system missed some of the highest rainfall that occurred over portions of the Big Island and Maui due to radar beam blockage by the terrain. The MRMS “Pass 2” analysis, which is supposed to incorporate radar and rainfall data, may not be fully ingesting the rainfall data which would have helped fill in the gaps caused by the terrain blockage. Compare the MRMS analysis with the 4-day accumulated rainfall from the Hawaiʻi Climate Data Portal’s (HCDP) daily rainfall grids (below). The HCDP’s data show much higher rainfall totals over the windward slopes of the Big Island and Maui, and are in better agreement with the rain gage totals. The MRMS analysis is still useful to see what also happened over the coastal waters, but if you want an accurate picture of what happened over land, it’s probably better to use the HCDP data.

Map of gridded rainfall in inches for the 4-day period from February 7th through February 10th, 2026. The data come from the HCDP daily rainfall data grids.
In addition to the rainfall graphics, it’s also useful to look at specific amounts recorded by the automated rain gages. I’ve included the top 5 from each county in the table below. The rainfall totals were pulled from the Hawaiʻi Rainfall Summary (RRAHFO) text product issued by HFO and archived by Iowa State University. All of the amounts are midnight-to-midnight totals. Locator maps for each of the gages are included below the table.
| Station | Feb 7 | Feb 8 | Feb 9 | Feb 10 | 4-day total |
| Kauaʻi | |||||
| Waiʻaleʻale | 2.34 | 5.12 | 7.12 | 3.43 | 18.01 |
| Kilohana | 1.75 | 1.32 | 5.34 | 2.82 | 11.23 |
| N Wailua Ditch | 0.94 | 3.24 | 3.86 | 2.34 | 10.38 |
| Wainiha | 2.04 | 0.73 | 6.45 | 1.03 | 10.25 |
| Waihi Rain Gage | 1.31 | 2.94 | 3.12 | 2.12 | 9.49 |
| Oʻahu | |||||
| Moanalua Rain Gage | 4.52 | 5.10 | 2.36 | 1.41 | 13.39 |
| Tunnel Rain Gage | 4.31 | 4.83 | 2.41 | 1.72 | 13.27 |
| Kaʻala | 6.43 | 1.18 | 0.98 | 0.80 | 9.39 |
| Poamoho Rain Gage 1 | 4.58 | 1.74 | 2.18 | 0.71 | 9.21 |
| Mānoa Lyon Arboretum | 2.01 | 2.82 | 2.34 | 1.85 | 9.02 |
| Maui County | |||||
| Waikamoi Treeline | 2.12 | 15.19 | 10.40 | 0.74 | 28.45 |
| Puʻu Kukui | 0.81 | 9.66 | 10.41 | 1.74 | 22.62 |
| West Wailuaiki Stream | 2.79 | 9.63 | 3.71 | 2.72 | 18.85 |
| Puʻu Aliʻi | 5.17 | 6.70 | 2.46 | 1.02 | 15.35 |
| Park Headquarters | 0.82 | 6.13 | 4.73 | 0.15 | 11.83 |
| Big Island | |||||
| Laupāhoehoe | 3.65 | 23.66 | 4.39 | 1.26 | 32.96 |
| Honokaʻa | 8.25 | 9.99 | 1.10 | 1.09 | 20.43 |
| Kawainui Stream | 5.31 | 9.89 | 2.81 | 1.07 | 19.08 |
| Waipunalei | 1.76 | 9.71 | 3.90 | 0.68 | 16.05 |
| Kehena | 6.59 | 6.69 | 1.57 | 1.08 | 15.93 |


Maps of locations for the top 5 rainfall totals on Kauaʻi, Oahu, Maui County, and the Big Island. Station location data are from the HCDP.
The Waikamoi Treeline, Laupāhoehoe, and Honokaʻa totals are worth examining in greater detail. At Waikamoi Treeline and Laupāhoehoe, the peak rainfall period straddles February 8th and 9th. Return periods for the 12-hr and 24-hr durations are really high, indicating a very low probability of occurrence in any given year. At Honokaʻa, it’s the peak short term accumulation that stands out. The incredibly intense burst of rainfall mentioned above that occurred during the evening of February 7th is highly unusual for this location and fortunately didn’t last too long. The table below shows the peak rainfall amounts (in inches) for different durations over the February 7th through 10th event. Return periods (in years) are in the rows below the rainfall amounts. The Waikamoi Treeline and Laupāhoehoe totals are based on 5-minute rainfall data from the Hawaiʻi Mesonet. The Honokaʻa totals are from the 15-minute data available on the HADS website. Return periods for each site are from NOAA Atlas 14.
| Station | 1-hr | 3-hr | 6-hr | 12-hr | 24-hr |
| Waikamoi Treeline | 2.47 | 4.82 | 9.06 | 15.23 | 22.93 |
| 2 – 5 | 5 – 10 | 25 | 50-100 | 100-200 | |
| Laupāhoehoe | 2.31 | 5.58 | 9.42 | 15.56 | 24.98 |
| 1 – 2 | 5 – 10 | 25 – 50 | 50-100 | 100-200 | |
| Honokaa | 4.55 | 7.47 | 7.87 | 9.80 | 15.59 |
| 200-500 | 100-200 | 25 – 50 | 10 – 25 | 25 – 50 |
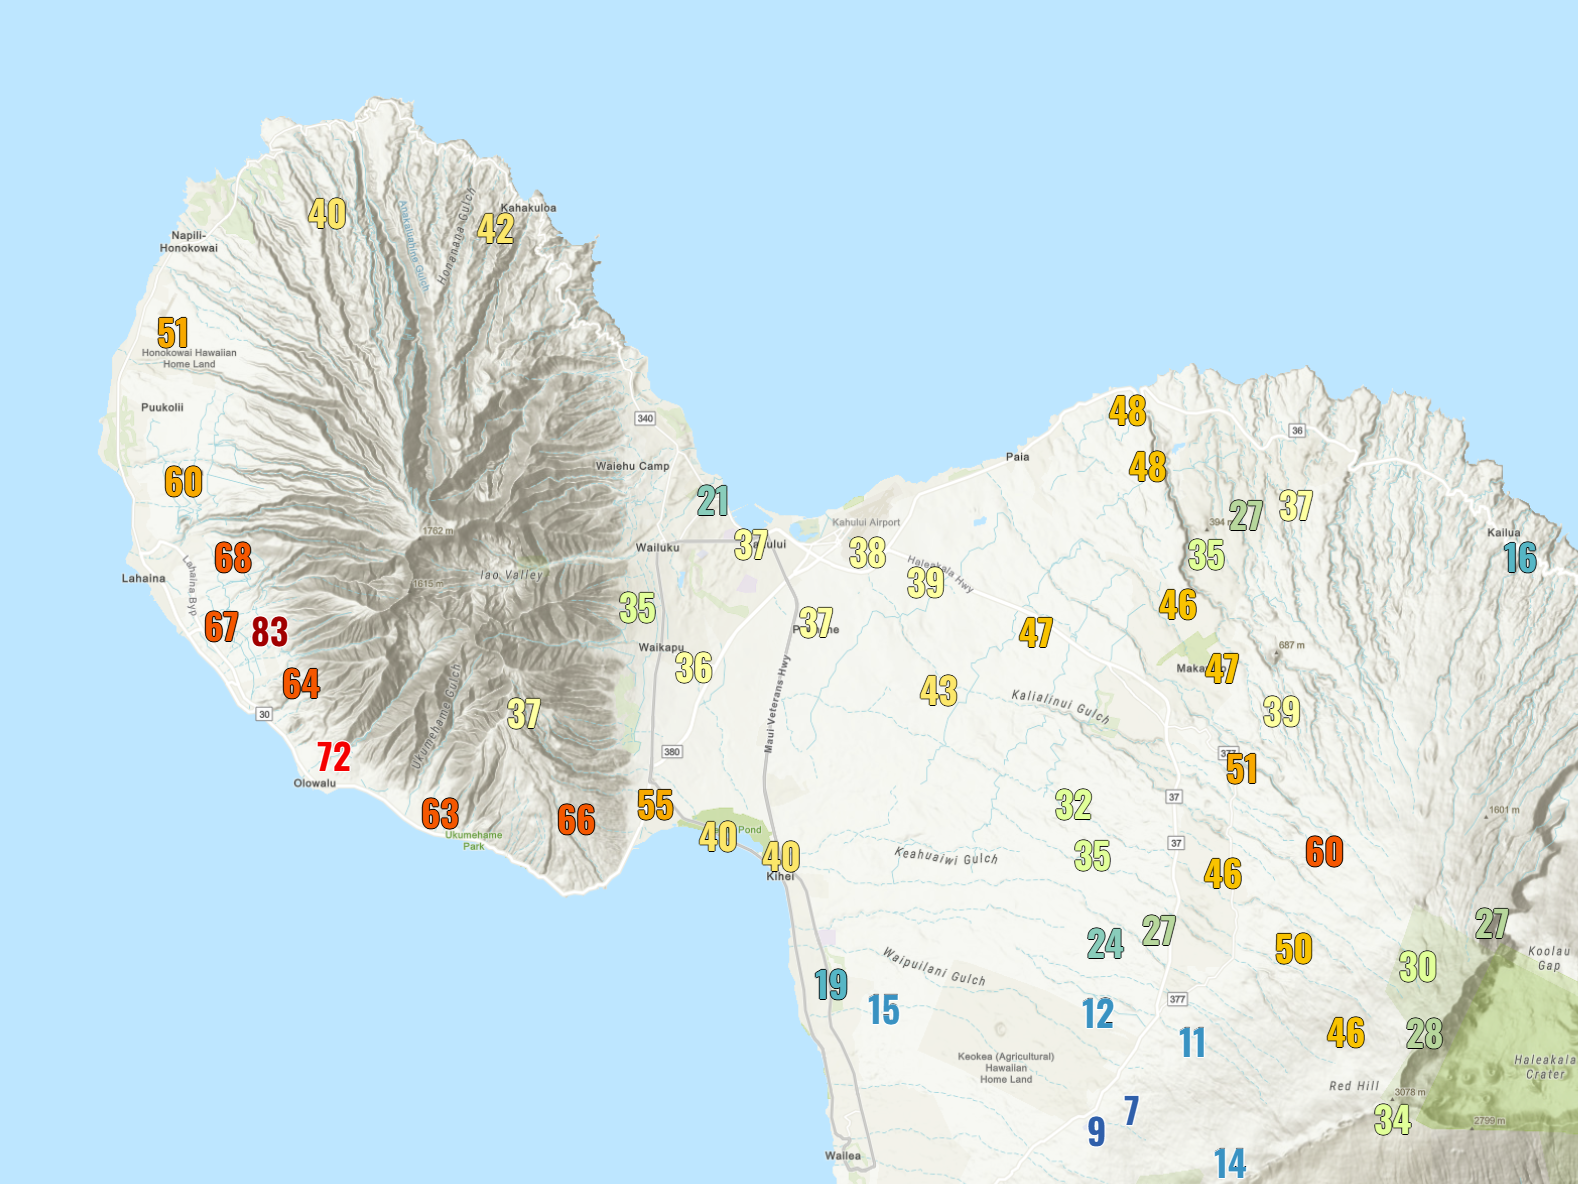
While the highest rain rates occurred during the night of February 8th and into the early morning of February 9th, peak wind gusts across the state mainly occurred on February 9th. Strong winds produced most of the impacts and damage from this event. The maps below show the peak wind gusts for February 9th in miles per hour. Unlike with rainfall data, frequency statistics are not available for wind data as far as I know.


Maps of peak gusts for February 9th, 2026 for Kauaʻi, Oʻahu, Molokaʻi, Maui, and the Big Island. All values are in mph. The maps are from the National Weather Service’s Weather and Hazard Data Viewer.
From my perspective, I can deal with the Seahawks pounding an opposing team on Super Bowl Sunday. But a wind and rain event like we just had, not so much! Although we’re still within the wet season, I’m hoping we’ll have a period of calmer conditions so that folks can recover.
2 responses to “Super Bowl Sunday Storm of 2026 – Crazy Wind and Rain Values”
[…] A look at the statewide rainfall picture for February 20-21, 2026 using MRMS Pass 2 radar + rain gage data (map below) shows that the Koʻolau Range on Oʻahu received the highest amounts, by far. A map zoomed in to just Oʻahu shows the localized extreme amounts near Kāneʻohe. The amplified rainfall over the Koʻolau Range, along with much lower amounts over the open ocean seem to suggest that this was mainly a terrain-driven (orographic) event boosted substantially by the instability from the upper tropospheric trough. This is similar to the Super Bowl Sunday event I covered in my February 13 post. […]
[…] started happening. The first of the big events hit the state on February 7-10 in what I called the “Super Bowl Sunday” storm. Even though the 4-day rainfall totals were impressive, rain rates were generally manageable and […]