
Now that Lowell is gone, I can now finish up my post on Hurricane Lālā’s rainfall. I figure I better get it done before the next system comes into the area! There’s a lot to cover whenever there’s a significant tropical cyclone that impacts the state, including winds and surf/storm surge in addition to heavy rainfall and flooding impacts. I will be focusing on the rainfall and flooding impacts here. Otherwise I’ll never get this done. More comprehensive details will likely be provided by the Honolulu Forecast Office (HFO) as they complete storm damage assessments, especially since Lālā produced the most significant impacts from a hurricane statewide since Hurricane ʻIniki in 1992. A preliminary Post Tropical Cyclone Report (Product ID: PSHHFO) was issued by HFO on August 21 (updated on September 10) and includes their initial findings and data.
Hurricane Lālā originated within a roughly east-to-west surface low pressure trough far east-southeast of the state. The trough produced disorganized thunderstorms for a long time, but the models forecasted an eventual threat to the state. The National Hurricane Center (NHC) initiated “Invest 93C” on August 9 to more closely monitor the system. The image below shows that it was still rather disorganized on August 10.

NOAA/NESDIS GOES-18 “Sandwich RGB” image combining visible data in gray shades and infrared data in bright colors. The visible data show the low clouds while the color enhanced infrared portions highlight thunderstorms and high clouds. The image is from 7:50 AM HST, August 10, 2026. Please click on the link for more information about the Sandwich RGB. Annotations in yellow are mine.
It took several days for Invest 93C to become better organized, and became Potential Tropical Cyclone One-C (PTC-1C) on the morning of August 12. The system already had tropical storm intensity with 35 knots of wind, but it still had a broad cyclonic rotation without thunderstorms consolidated around a low pressure center. There were even secondary circulations around the main center. By then, the model forecasts tightened up and focused on an impact near or over the Big Island in about three or four days. This scenario reminded me of August 2015 when a similar trough produced what became Hurricane Kilo. Models kept forecasting a tropical cyclone to develop within the trough, then lifted it northward to hit the state. Since it took several days to develop, the main trough progressed too far west by the time Kilo finally got going and it missed catching the mid-to-upper level trough that was supposed to pull it into the island chain. There was no missed opportunity in the case of Lālā.

Same as previous, but for 7:50 AM HST, August 12.

Zoomed in GOES visible image loop produced by Tropicaltidbits.com. The loop is from the morning of August 12, 2026. Annotations in yellow are mine.
Thunderstorms consolidated near the center on the night of August 12, resulting in a change in designation from PTC-1C to Tropical Storm Lālā early in the morning on August 13. With Lālā already within a couple of days away, NHC issued a Hurricane Watch for the Big Island. Model forecast tracks clustered relatively tightly around a path taking Lālā over or just south of the Big Island, and to the south of the rest of the state.

NOAA/NESDIS GOES-18 color enhanced infrared (IR) image loop covering the tropical central and east Pacific on the afternoon of August 13 (HST). In this enhancement curve, yellow/orange/red colors show the coldest (and highest) cloud tops from thunderstorm activity. Lighter gray shades are low clouds, and the darker gray areas are the ocean or land areas. Lala is now a tropical storm east-southeast of the Big Island.
The loop below shows Lālā as it gradually strengthened during its approach to the Big Island. It was designated a hurricane at 8 AM HST on August 15. The center passed (unofficially) less than 25 miles southwest of South Point, and the outer portion of its eyewall appeared to move over the communities of Nāʻālehu, Waiōhinu, Ocean View Estates, and Miloliʻi. As Lālā continued northwestward, a large rainband developed in the eastern semicircle of its circulation (image loop below). This band produced the most intense rainfall over the Big Island and I suspect produced the most intense flooding in the Kaʻū District. I’ll discuss this further below.
Heading into the night of August 15, Lālā deviated slightly to the right of the forecast track and moved closer to Maui County and Oʻahu. This northward shift resulted in stronger winds over these islands. However, its close encounter with the Big Island caused some weakening of the tropical cyclone, and NHC declared Lālā to be a high-end tropical storm at 2 AM HST on August 16. NHC also cited dry air intrusion as another factor contributing to its weakening.
Lālā turned west after passing south of Oʻahu. Its primary rainband, in the northeastern quadrant of its circulation (loop below), moved over Oʻahu during the pre-dawn hours of August 16 and produced large flood waves in Waiāhole, Waikāne, and Mānoa Streams. The rainband also moved over Kauaʻi after Lālā’s center passed south of that island and produced flooding in Hanalei River. The flooding closed Kūhiō Highway near Hanalei town, but nothing more than they frequently experience in this area.
I’ve included the preliminary “Best Track” plot for reference on Lālā’s path from its origination point as a tropical cyclone to the area far northwest of the main Hawaiian Islands after it moved through the Papahānaumokuākea Marine National Monument.

Same as previous “Sandwich RGB” loop, but from the morning of August 14. The loop is also zoomed in and centered on now Tropical Storm Lālā, which is why the island outlines and latitude/longitude grid moves.

Composite reflectivity image from 3:58 PM HST, Saturday, August 15, 2026 from the NOAA National Severe Storms Lab’s Multi-Radar/Multi-Sensor (MRMS) system website. The images from the website were cropped for visual clarity. Annotations in black are my own.

GOES infrared image loop, from 3:30 PM to 10:30 PM HST, August 15, centered on Hurricane Lālā from the CIRA/RAMMB archive. With this color enhancement curve, blues, greens, and reds are the coldest and highest cloud tops. Lālā’s center and eyewall are offshore to the west of Miloliʻi on the Big Island.

Same as previous, but from 4:20 to 8:20 AM HST, August 16.

Preliminary “Best Track” plot using data from the NHC GIS page. All times are in UTC, which is 10 hours ahead of HST (e.g. 1200 UTC is 2 AM HST).
The outer rainbands in Lālā’s circulation started affecting the Big Island on August 14, and trailing rainbands were still affecting Kauaʻi into August 17. Taking this 4-day period, I looked at the rainfall accumulations from across the state. The map of gridded rainfall data (below) from the Hawaiʻi Climate Data Portal (HCDP) shows a large area of more than 20 inches over the southeastern half of the Big Island and along the windward slopes of Haleakalā on Maui. Oʻahu had several locations with more than 10 to 15 inches over the Koʻolau Range, and Kauaʻi had similar totals over Waiʻaleʻale and Kilohana.
These amounts were higher than the forecast, especially for the peak amounts on the four largest islands. I haven’t looked at the verification data on the forecast vs. actual speed of Lālā, but I suspect that a good portion of the rainfall excess may have been due to the slower speed of Lālā as it interacted with the Big Island. This allowed for longer dwell times of the rainbands over specific areas and thus higher rainfall totals. I’m sure a deeper dive into the data, perhaps by some graduate student at UH-Mānoa, can provide better insight than my initial guess.

Map of gridded rainfall in inches for the 4-day period from August 14 through 17, 2026. The data come from the HCDP daily rainfall data grids.
For a detailed look at the daily totals, I’ve provided the table below which includes the top 5 rainfall totals for each county. The rainfall totals are from the Hawaiʻi Climate Data Portal (HCDP), Natural Resources Conservation Service, the Western Region Climate Center (WRCC) Hawaiʻi RAWS archive, and the Hawaiʻi Rainfall Summary (RRAHFO) text product issued by HFO. The RRAHFO is available at the NWS text product archive hosted by Iowa State University. All of the amounts are midnight-to-midnight totals. Locator maps for each of the gages are included below the table.
| Station | Aug 14 | Aug 15 | Aug 16 | Aug 17 | 4-day Total |
| Kauai | |||||
| Waiʻaleʻale | 1.05 | 4.19 | 6.24 | 3.83 | 15.31 |
| Kilohana | 0.41 | 3.92 | 9.78 | 0.60 | 14.71 |
| Mōhihi Crossing | 0.10 | 1.62 | 6.42 | 0.18 | 8.32 |
| Waiakoali | 0.07 | 1.50 | 5.22 | 0.09 | 6.88 |
| Waiʻalae | 0.03 | 0.52 | 4.80 | 0.39 | 5.74 |
| Oʻahu | |||||
| Poamoho Rain Gage No. 1 | 0.41 | 0.32 | 12.10 | 2.45 | 15.28 |
| Moanalua Rain Gage No. 1 | 0.75 | 0.91 | 10.41 | 1.71 | 13.78 |
| Mānoa Lyon Arboretum | 0.77 | 1.83 | 10.46 | 0.65 | 13.71 |
| Kalawahine | 0.47 | 0.88 | 8.56 | 1.54 | 11.45 |
| Kamananui Stream | 0.47 | 0.41 | 10.28 | 0.21 | 11.37 |
| Maui County | |||||
| Waikamoi Treeline | 3.20 | 16.63 | 4.37 | 0.21 | 24.41 |
| Nēnē Nest | 1.13 | 12.74 | 6.76 | 0.00 | 20.63 |
| West Wailuaiki Stream | 2.77 | 3.39 | 11.22 | 0.80 | 18.18 |
| Haleakalā Summit | 0.75 | 4.82 | 12.47 | 0.00 | 18.04 |
| Kamehamenui 1 | 0.17 | 6.91 | 7.29 | 0.00 | 14.37 |
| Big Island | |||||
| Laupāhoehoe | 6.06 | 32.12 | 5.36 | 0.30 | 43.84 |
| Nāhuku | 2.57 | 28.02 | 6.63 | 0.46 | 37.68 |
| Nēnē Cabin | 0.11 | 30.50 | 6.59 | 0.00 | 37.20 |
| Silversword | 2.96 | 28.34 | 3.89 | 0.54 | 35.73 |
| Hakalau | 3.64 | 26.72 | 4.95 | 0.13 | 35.44 |


Maps of locations for the top 5 rainfall totals on Kauaʻi, Oʻahu, Maui County, and the Big Island. Station location data are from the HCDP and Mesowest.
My main benchmark when assessing extreme rainfall events is the November 1-2, 2000 event. That heavy rain event, produced by the combination of a tropical cyclone remnant moving under a strong upper tropospheric trough, produced over 37 inches in 24-hours and more than 22 inches in 6 hours. It’s the 22 inches in 6 hours that stands out for me. Even the U.S. record-breaking event in Waipā, Kauaʻi in April 2018, with more than 49 inches in 24-hours, didn’t beat 22 inches in 6 hours.
When I saw the 24-hour totals from Lālā, I initially thought, “ok, it wasn’t as high as November 2000 so maybe the damage wasn’t as bad either.” However, when I saw the damage images and videos, the impacts from Nāʻālehu to Pāhala and Wood Valley seemed much worse than what I saw on the ground during the flood damage surveys after the 2000 event. Gulches and bridges that were widened and improved near Pāhala after 2000 appeared to be insufficient to handle Lālā’s flooding. Roads appeared to have greater damage, and crevices created by the runoff seemed to be deeper and more widespread. What happened?
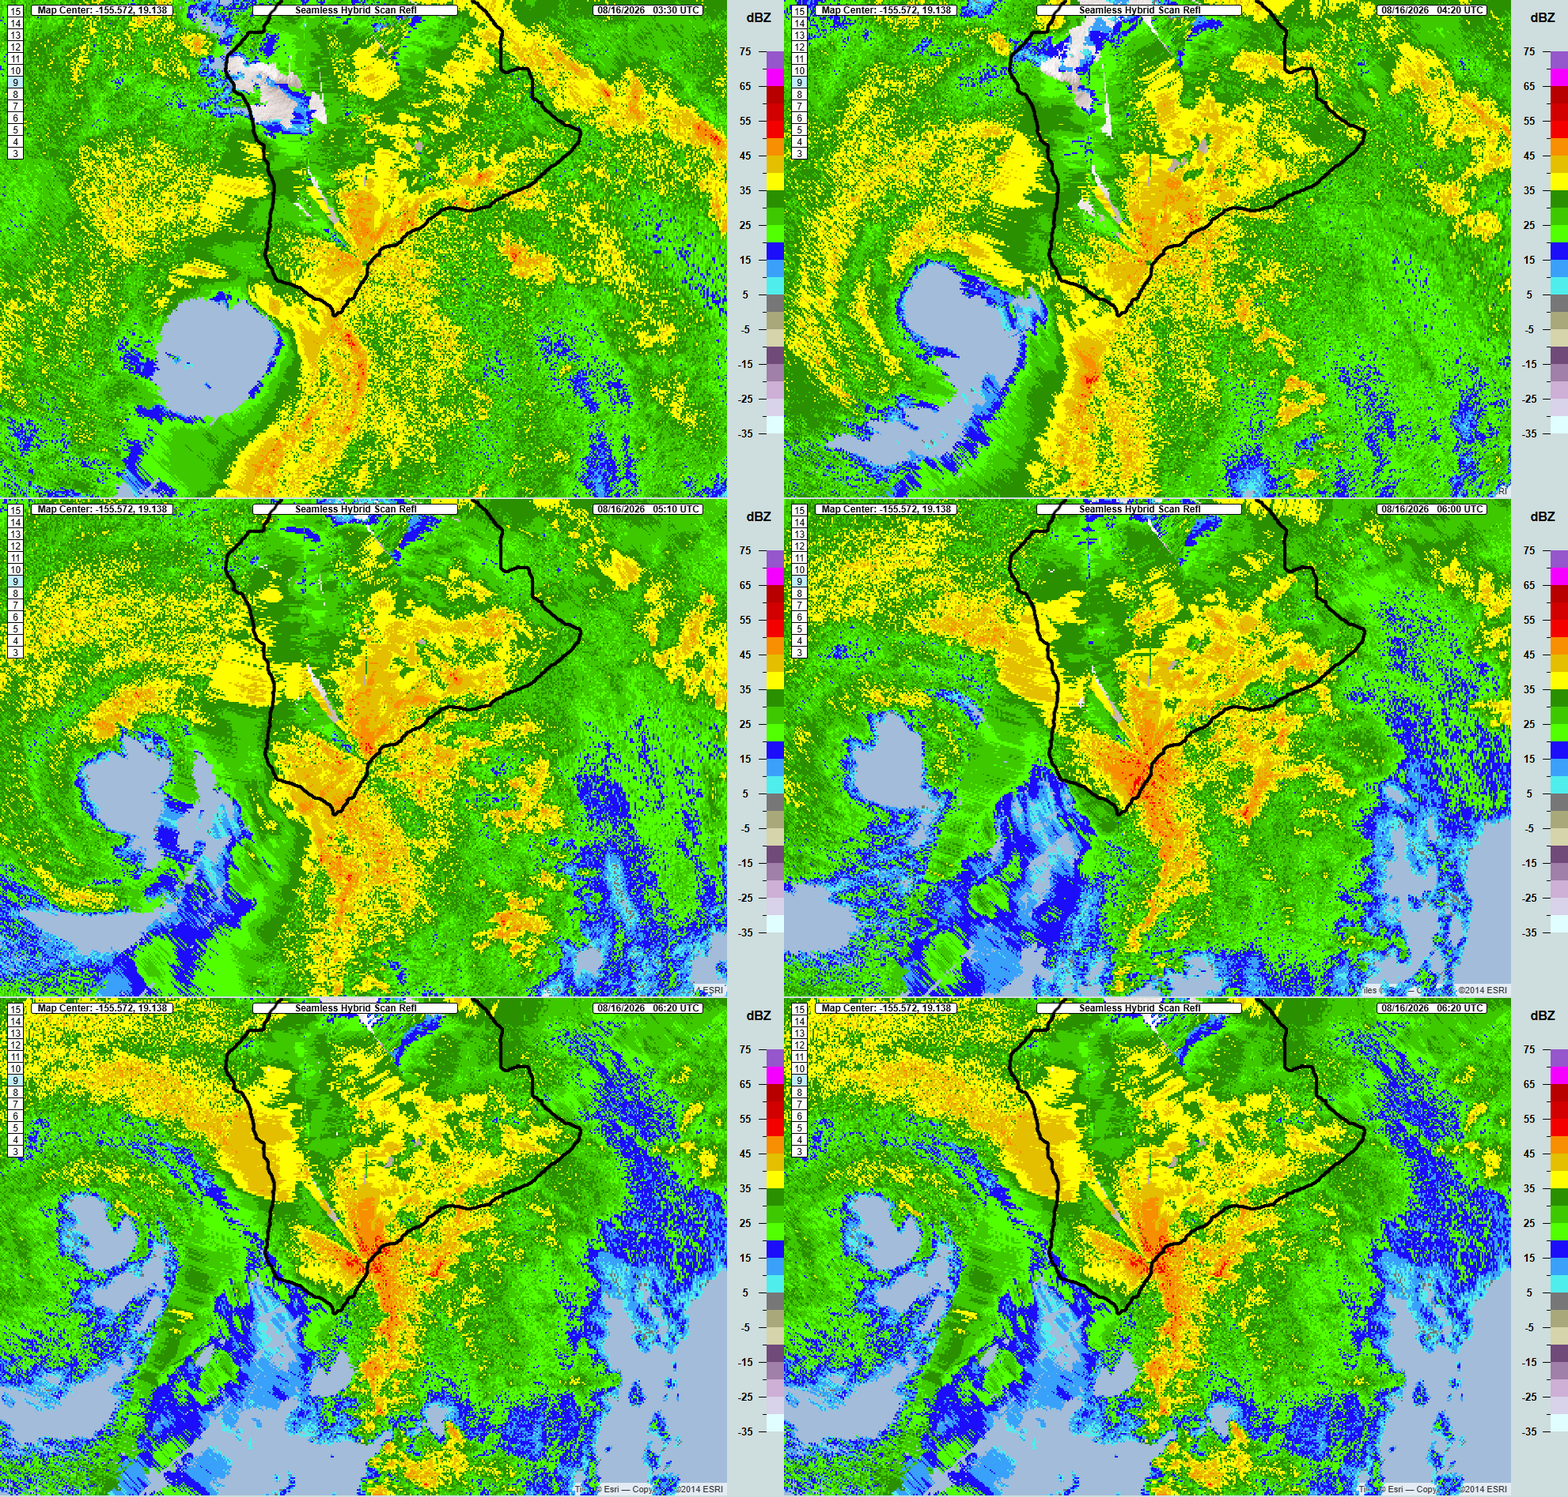
Unfortunately, the South Hawaiʻi radar (PHWA) feed stopped at around 8:30 PM HST. I’m assuming this was due to impacts from Lālā’s winds and/or rainfall. The last available data (loops below) showed an intensifying rainband just northeast of Nāʻālehu moving towards the northeast. Instantaneous rain rates from the MRMS data feed were greater than 5.5 inches per hour! But after 8:30 PM, I couldn’t view the progression of the rainband over the rest of the Kaʻū District.

Seamless Hybrid Scan Reflectivity images from 5:30 PM to 8:20 PM HST, August 15, 2026 from the NOAA National Severe Storms Lab’s Multi-Radar/Multi-Sensor (MRMS) system website. The images from the website were cropped for visual clarity. I added the black map outline.

Same as above, but for instantaneous rain rate.
Although the radar data feed went offline, the satellite data (loop above and annotated still frames below) showed the deep convection in the rainband intensifying as it moved toward Pāhala and Kapāpala.


Annotated images from 8:00 PM and 9:30 PM HST frames in the CIRA/RAMMB loop above.
What do the rain gages say? The HCDP posted a storm event page covering Hurricane Lālā. Their write-up showed that there was a peak one-hour rainfall accumulation of 4.37 inches at their Kaiholena station (mauka from Punaluu/Sea Mountain) from 7:30 to 8:30 PM HST on August 15. A one-hour total of 4.37 inches is impressive. However, it’s not too much higher than the peak one-hour totals from Kapāpala Ranch in the November 2000 event (figure below).
Unfortunately, the HCDP event page only shows Hawaiʻi Mesonet stations. This accounts for less than half of the real-time rainfall stations in the state. The National Weather Service operates gages in Pāhala and Kapāpala Ranch, and the state operates a RAWS site at Kapāpala makai from the ranch site. All three recorded one-hour totals over 5 inches, with the peak being 5.12 inches at the Kapāpala RAWS site between 9:00 and 10:00 PM HST. From the graphs below, you can see the time shift and intensification of the one-hour peaks as the band moved from the Nēnē Cabin and Kaiholena sites northeastward to the Kapāpala RAWS location. With runoff already at high levels and the ground already saturated, this deluge likely sent a large flood wave down all of the drainages in the Pāhala and Wood Valley areas and helps explain why the damage looked worse from Lālā than in November 2000, even though the 6- to 24-hour totals were not as high.


Plot of hourly rainfall totals from the Kapāpala Ranch Hydronet gage during the November 1-2, 2000 flash flood event. I used this plot in numerous presentations, mainly to highlight the 22 inches in 6 hours.


Plots of one-hour rainfall at Nēnē Cabin RAWS, Kaiholena, and the Kapāpala RAWS. The RAWS data are from the WRCC archive. Kaiholena data are from the HCDP. The plotted accumulations are for the one-hour period ending at the time listed on the x-axis.
In other areas of the state, the main rainband from Lālā produced heavy rainfall and flooding, but nothing as intense as in the Kaʻū District during the evening of August 15. Several storm total rainfall amounts were higher over the windward areas of the Big Island and there were numerous reports of flash flooding, but nothing to the extent of what happened in the Kaʻū. Wailuku River levels went very high (hydrograph below) and showed up in a lot of news and social media feeds, but the levels were below what happened during Hurricane Lane in 2018 (record flow) and there were little impacts from the river itself other than perhaps briefly closing the bridge at Piʻihonua.
As mentioned previously, when Lālā moved south of Oʻahu, the main rainband produced large spikes in the flow within several streams along the Koʻolau Range on Oʻahu. This produced flooding of roads and properties in the Waiāhole and Waikāne areas, and in the Mānoa area of Honolulu.


Hydrographs of data from the U.S. Geological Survey (USGS) for Wailuku River, Waiāhole Stream, and Mānoa Stream at Woodlawn from August 13 through 17. The orange shaded region indicates possible flooding impacts and the purple indicates exceedance of record stage. These are not necessarily indicators of “Minor” and “Major” flooding and are different from typical depictions for NWS gages in the rest of the country.
The table below shows the peak rainfall amounts (in inches) for different durations over the August 14 through 17 period. Return periods (in years) are in the rows below the rainfall amounts. The data are from the Hawaiʻi Mesonet archive, HADS archive, and the WRCC RAWS archive. Return periods for each site are from NOAA Atlas 14. Big Island rain gages, especially in the Kaʻū District, had incredibly high return periods for many durations indicating the amounts were extremely rare for the area.
| Station | 15-min | 1-hr | 3-hr | 6-hr | 12-hr | 24-hr | 48-hr |
| Oʻahu | |||||||
| Lyon | 0.86 | 2.71 | 6.58 | 7.73 | 8.74 | 10.90 | 12.22 |
| < 2 | 2-5 | 10-25 | 10-25 | 5-10 | 5-10 | 5-10 | |
| Moanalua RG No. 1 | 0.72 | 2.39 | 5.71 | 7.53 | 9.77 | 11.32 | 13.13 |
| < 2 | 2-5 | 5-10 | 5-10 | 10-25 | 5-10 | 5-10 | |
| Poamoho RG No. 1 | 0.76 | 2.21 | 3.57 | 5.79 | 9.75 | 12.26 | 14.68 |
| < 2 | < 2 | < 2 | 2 | 2-5 | 2-5 | 2-5 | |
| Maui County | |||||||
| Nēnē Nest | 0.49 | 1.35 | 3.03 | 5.38 | 9.77 | 14.42 | 20.63 |
| < 2 | < 2 | 2-5 | 10-25 | 25-50 | 50-100 | 50-100 | |
| Haleakalā Summit | 0.75 | 2.12 | 4.50 | 8.02 | 13.21 | 15.85 | 17.29 |
| < 2 | 5-10 | 10-25 | 100-200 | 200-500 | 200-500 | 50-100 | |
| Waikamoi Treeline | 0.48 | 1.49 | 3.90 | 7.08 | 13.06 | 18.25 | 24.13 |
| < 2 | < 2 | 2-5 | 5-10 | 25-50 | 25-50 | 25-50 | |
| Big Island | |||||||
| Hakalau | n/a | 1.96 | 5.15 | 9.62 | 17.31 | 28.00 | 34.50 |
| n/a | 2-5 | 10-25 | 50-100 | 200-500 | 500-1000 | 200-500 | |
| Kahuku Ranch | n/a | 2.44 | 5.05 | 8.53 | 13.06 | 15.84 | 16.15 |
| n/a | 50-100 | 200-500 | 1000 | > 1000 | > 1000 | > 1000 | |
| Kaiholena | 1.44 | 4.37 | 9.50 | 15.23 | 21.39 | 24.67 | 28.11 |
| 2-5 | 25-50 | 100-200 | 200-500 | 200-500 | 100-200 | 25-50 | |
| Kapāpala Ranch | 1.70 | 5.10 | 11.09 | 15.49 | 20.85 | 24.68 | 26.72 |
| 5-10 | 50-100 | 200-500 | 200-500 | 100-200 | 100-200 | 25-50 | |
| Kapāpala RAWS | n/a | 5.12 | 10.85 | 15.30 | 20.95 | 24.14 | 25.51 |
| n/a | 100-200 | 500-1000 | 200-500 | 200-500 | 100-200 | 25-50 | |
| Laupāhoehoe | 1.19 | 2.81 | 6.90 | 12.64 | 21.47 | 33.05 | 42.56 |
| 2-5 | 5 | 25-50 | 100-200 | 200-500 | 500-1000 | 500-1000 | |
| Lower Kahuku | n/a | 3.20 | 7.09 | 12.84 | 20.06 | 23.73 | 25.27 |
| n/a | 10-25 | 50-100 | 200-500 | 500-1000 | 500-1000 | 100-200 | |
| Nēnē Cabin | n/a | 3.89 | 9.23 | 15.16 | 25.22 | 35.84 | 37.16 |
| n/a | 50-100 | > 1000 | > 1000 | > 1000 | > 1000 | > 1000 | |
| Pāhala | 1.52 | 5.27 | 12.10 | 16.57 | 21.01 | 23.70 | 24.55 |
| 10 | 500-1000 | > 1000 | > 1000 | 1000 | 200-500 | 50-100 |


Maps of locations for the sites included in the rainfall frequency analysis. Station location data are from the HCDP and Mesowest.
Are you still here? This is going on longer than I wanted, but I hope I was able to provide some additional insight into the rainfall aspect of Hurricane Lālā, especially for the Kaʻū District of the Big Island. It’s a good thing I decided on focusing on just the rainfall. If I tried to add in other analyses, such as wind, I would never get this done. I’ll leave the rest to others. 🙂