Well, we got our first significant weather event for 2026 this week, giving the main Hawaiian Islands a nice start to the year rainfall-wise. The global models overforecasted rainfall totals at the 3- to 4-day forecast time frame, then backed off a bit on event severity late Saturday (January 3rd). By that time, the war drums were banging pretty loud (me included) about the rainfall and flood threat, especially for the Big Island. In the end, heavy rainfall did occur on several islands across the state, and the Big Island did have a flash flood, but the totals ended up being not quite as high, and runoff not quite as extensive as anticipated late last week. In this post, I’ll go over some of the event highlights and rainfall totals spanning the 3-day event.
In my last post on January 3rd, I showed a GOES-18 infrared (IR) satellite image loop (below) of a developing low pressure system aloft to the north of the main Hawaiian Islands. The low was expected to strengthen and evolve into a small kona low. The kona low did develop, but was so small that it didn’t produce a closed isobar in the surface analysis map (second figure below). That’s why I included “sort of” in the title of my post.

NOAA/NESDIS GOES-18 infrared image loop from 8:10 AM to 10:00 AM HST Saturday, January 3, 2026. The yellow circle indicates the position of a developing low pressure system aloft that will destabilize the atmosphere over the Hawaiian Islands. The main Hawaiian Islands are below the yellow circle.

Surface analysis from 8 AM HST, January 4, 2026, posted by the Honolulu Forecast Office (HFO). The “L” northwest of Kauaʻi marks the position of the kona low’s pressure center. The dashed red line extending from the “L” delineates the pressure trough axis.
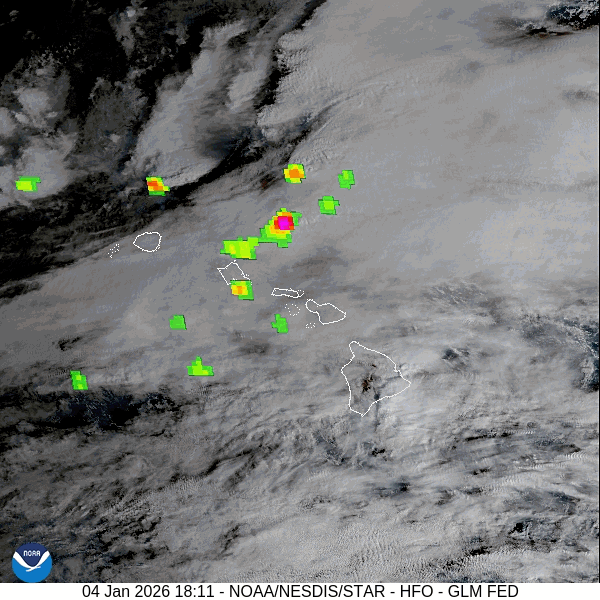
At the time of the surface map analysis (Sunday morning), thunderstorms were occurring over and around portions of the island chain. I woke up that morning to the sounds of thunder over the coastal waters south of Honolulu. The GOES image loop below includes Geostationary Lightning Mapper (GLM) data. GLM hotspots indicate thunderstorm activity. Fortunately for Oʻahu residents, the heaviest rainfall mostly remained offshore. Some of the high-resolution models forecasted some of this rainfall would be over land. It is an example of how, even at short forecast ranges, the high-resolution models can capture the “flavor” of the event, but miss on the details. It is an incredibly difficult forecast problem that has big implications for things such as streamflow forecasting by water models.
Below the GLM loop is a GOES IR loop over the same map domain. A couple of things are worth mentioning here. The blues, greens, yellows, and reds are, in order, increasingly colder and higher in the atmosphere. As the low pressure system aloft moves southward, the area of large scale upward motion also shifts southward. In the loop, you can see how the area of green spreads southward over the state. Also notice how the area of dark blue greatly expands over the eastern flank of the Big Island as the clouds deepen and increase in coverage. Rainfall over this part of the Big Island also increased in size and intensity during this time.

NOAA/NESDIS visible sector image loop centered on the main Hawaiian Islands with Geostationary Lightning Mapper (GLM) data overlaid. The loop covers the period from 8:11 AM to 10:36 AM HST, January 4, 2026. For more information on the GLM data, please click here.

NOAA/NESDIS color enhanced infrared sector image loop centered on the main Hawaiian Islands. The loop covers the period from 5:40 AM to 10:30 AM HST, January 4, 2026. In this enhancement curve, blues, greens, yellows, and reds show, in order, increasingly colder and higher cloud tops. Lighter gray shades are low clouds, and the darker gray areas are the ocean or land areas.
While all this activity on Sunday morning was interesting, the main impact from the event was expected to be heavy rainfall over the southeastern half of the Big Island, and the eastern and southeastern slopes of Haleakalā on Maui. Model forecasts projected over 15 inches of rainfall, most of which would occur during a 24-hour period straddling Monday, January 5 and Tuesday, January 6. The rainfall over the Big Island intensified Sunday night, and peaked Monday morning. The Multi-Radar/Multi-Sensor (MRMS) loop below covers the period of peak rainfall over the Big Island. In the loop, you can see bands of rainfall (yellow and orange) moving over the southeast half of the island from the east-southeast.

Composite reflectivity loop from 7:30 AM to 9:00 AM HST, Monday, January 5, 2026 from the NOAA National Severe Storms Lab’s Multi-Radar/Multi-Sensor (MRMS) system website. The images from the website were cropped for visual clarity.
MRMS Pass 2 data, which combines radar precipitation estimates with rain gage data (below), showed the highest event totals over the southeast half of the Big Island, east Maui, and over the waters southwest of Niʻihau. Upon closer inspection, it appears there are significant problems with the MRMS estimates over portions of the Big Island. The amounts appear to be too low when compared directly with rain gage data. I don’t know for sure why this occurred but suspect that the MRMS system may not have ingested the full gage datasets for bias adjustments of the radar estimates. Radar-only precipitation estimates based on data from the South Hawaiʻi radar (PHWA, near Nāʻālehu) for the Big Island north of Kīlauea volcano are almost always too low due to blockage of the lower radar beam angles. Incorporation of rain gage data, along with some other techniques in the Pass 2 processing, help correct the low bias. If you’re missing the rain gage data, you’ll end up with deficient Pass 2 estimates! Estimates for the mid-section of the state, including Oʻahu and Maui County west of the Haleakalā’s summit, are also likely degraded due to the lack of data from the Molokaʻi WSR-88D radar.

MRMS 3-day accumulated precipitation covering January 4th through 6th. The data in this graphic were downloaded from the MRMS repository on the Registry of Open Data on Amazon Web Services and processed using QGIS software. I believe the amounts on the Big Island north of Kīlauea volcano up to around ʻŌʻōkala are too low based on comparisons with rain gage data. Estimates over the mid-section of the state are also degraded due to the lack of data from the Molokaʻi WSR-88D radar.
Fortunately, we can also use data from our friends at the Hawaiʻi Climate Data Portal (HCDP)! They use all available rain gage data in their analysis, along with sophisticated cutting-edge processing techniques to produce a high-resolution gridded daily map of precipitation over the state. The 3-day rainfall map using HCDP data is shown below. It shows 10 to 13+ inches over the east side of the Big Island, the interior of Kauaʻi, and much lower amounts elsewhere. The amounts over the South Hilo District and northern Puna District are around double the estimates from the MRMS Pass 2 analysis.

Map of gridded rainfall in inches for the 3-day period from January 4th through 6th, 2026. The data come from the HCDP daily rainfall data grids.
As I did in my December 2025 heavy rain event totals post, I’ve included below the top event totals from selected gages across the state. In addition to the 3-day totals, I’ve also broken down the daily amounts as well. The daily amounts are all midnight-to-midnight HST values.
| Station | Jan 4 | Jan 5 | Jan 6 | 3-Day |
| Big Island | ||||
| Piʻihonua (HI Mesonet) | 0.81 | 9.67 | 2.40 | 13.69 |
| Glenwood | 3.47 | 7.64 | 1.88 | 13.19 |
| Piʻihonua (NWS) | 1.88 | 8.43 | 1.88 | 12.19 |
| Saddle Rd Quarry | 0.26 | 6.16 | 2.41 | 10.83 |
| Kealakomo | 6.08 | 3.57 | 0.32 | 9.97 |
| Pali 2 | 4.72 | 4.42 | 0.66 | 9.80 |
| IPIF | 0.95 | 5.83 | 0.89 | 8.60 |
| Pāpaʻikou Well | 0.54 | 6.47 | 1.48 | 8.49 |
| Kauaʻi | ||||
| Waiʻaleʻale | 1.79 | 2.80 | 8.76 | 13.35 |
| North Wailua Ditch | 2.36 | 0.89 | 2.00 | 5.25 |
| Common Ground | 1.48 | 2.27 | 0.42 | 4.17 |
| Hanalei | 1.06 | 2.37 | 0.54 | 3.97 |
| Kilohana | 2.42 | 0.76 | 0.58 | 3.76 |
| Oʻahu | ||||
| Poamoho Rain Gage No. 1 | 0.38 | 1.72 | 1.90 | 4.00 |
| Oʻahu Forest NWR | 0.49 | 1.53 | 0.55 | 2.57 |
| Kamananui Rain Gage | 0.24 | 1.67 | 0.59 | 2.50 |
| Kalāwahine | 0.33 | 1.54 | 0.28 | 2.15 |
| Kuaokalā | 2.09 | 0.00 | 0.00 | 2.09 |
| Maui County | ||||
| Kuiki | 0.77 | 4.48 | 1.40 | 6.65 |
| Pōhaku Pālaha | 0.62 | 4.76 | 0.51 | 5.89 |
| West Wailuaiki | 0.44 | 3.22 | 0.54 | 4.20 |
| Nākula | 3.52 | 0.29 | 0.06 | 3.87 |
| Puʻu Kukui | 0.00 | 2.94 | 0.08 | 3.02 |
Top rainfall totals (in inches) for each county from selected gages across the state of Hawaiʻi. The totals were obtained from the Hawaiʻi Mesonet, USGS, HFO’s Hawaiʻi Precipitation Summary (RRA) text products (via IEM website), and the WRCC RAWS page.
The highest rain rate I found in the rain gage data was 0.25 inches in 5-minutes (3 inches per hour) at 8:30 AM HST Monday, January 5 at the Hawaiʻi Mesonet’s Piʻihonua site. This occurred during a period of enhanced rainfall over the Hilo area. There may have been higher rates, but I didn’t have access to the high resolution datasets for all the sites. The water level in Wailuku River (image below) in Hilo rose significantly in response to this period of enhanced rainfall but remained well short of levels typically associated with widespread flooding issues within the Hilo area.

Hydrograph for the USGS’ Wailuku River site at Piʻihonua in Hilo. The plot is from the National Water Prediction Service website.
While the event totals of 10 to 13+ inches on the Big Island were significant, the rainfall was, for the most part, spread out enough over time to prevent significant flooding impacts. The main impact I’m aware of was the closure of Highway 11 (Māmalahoa Highway) southwest of Pāhala town in a flood prone section known as “Kāwā Flats”. Kaʻalāiki Road, a secondary road mauka from the highway, was also closed, probably due to runoff at low water crossings.
Stepping back a bit, the combination of the December 2025 heavy rain event over the west half of the state and this kona low event has really helped restore streamflow levels. The 28-day USGS streamflow map as of January 6 (below) showed most of the gages to be at near normal flow levels across the state. Unfortunately, gages in the Kohala region of the Big Island and most of the sites on Maui are still at below normal levels.

Map of 28-day average streamflow as of January 6, 2026 from USGS gages across the state. Percentile classes are listed at the bottom.
How did this rain event affect the drought picture? The latest U.S. Drought Monitor map, posted on January 8 with data as of January 6 showed modest improvement over the Big Island with extreme drought (D3 category) over the Kaʻū District easing to severe drought (D2). No improvements to drought categories were made elsewhere on the Big Island, which in my opinion is pretty conservative, but I imagine additional improvements will show up in the coming weeks. A couple of decent cold fronts are projected to pass through the island chain next week. Hopefully, these systems will be strong enough to put some much needed rainfall over Maui and the Kohala Mountains on the Big Island and further ease the drought picture over the state.

U.S. Drought Monitor map for the main Hawaiian Islands as of January 6, 2026. The D1-D4 categories are the different levels of drought. The D0 category, for abnormally dry conditions, can be considered as “pre-drought”.
One response to “Rainfall from the (Sort of) Kona Low of January 4-6, 2026”
[…] most of the Big Island and Maui County, at least January 2026 started out with better conditions. A small kona low managed to deliver significant rainfall to the southeast half of the Big Island to help ease […]