
We are currently in the heart of the hurricane season and just had a tropical cyclone named Fausto grab our attention for a bit. Fausto became a tropical cyclone on July 18 at 11.2N latitude and 108.6W longitude, and traveled steadily across the east and central Pacific over the next couple of weeks. If you’re not familiar with where those coordinates are on a map, just know that it’s farther east from Hawaiʻi than Las Vegas, Nevada. So now most people in Hawaiʻi will go, “ah okay, I get it.” While it was still in the east Pacific basin (east of 140W longitude), some weather model forecasts indicated Fausto would either move over or pass close to the main Hawaiian Islands. At that point, the entire chain easily fell within the forecast error cone and local emergency managers, the media, and others started paying close attention. The forecast track remained close enough to the state to warrant deploying the NOAA Gulfstream IV and Air Force Reserve WC-130J “Hurricane Hunters” to provide enhanced data collection in and around the tropical cyclone.
In the end, Fausto tracked north of the state. Along the way it hit hostile environmental conditions in the form of marginal sea surface temperatures, dry mid-level air, and strong vertical wind shear. These conditions ended the career of Fausto as a tropical cyclone. Fortunately, it remained far enough away to not require tropical cyclone watches or warnings for the Hawaiian Islands, though a Tropical Storm Warning was needed for the offshore waters within 200 nautical miles (NM) of the state.
With Fausto fresh on our minds, I thought it would be interesting to take a look at tropical cyclones that threaten the main Hawaiian Islands. I’m defining a “threatening” tropical cyclone as one that moves into the offshore waters. It’s a nice objective measure, and if it passed within 200 NM of any island, at some point in time the state was likely within the forecast error cone, which would get the attention of a lot of folks in the islands. There are definitely other metrics that can be used, such as the issuance of watches and/or warnings. However, watches and warnings depend on forecaster judgement for issuance, and there are sometimes “non-meteorological factors” that come into play. The criteria for watch and warning lead times have changed over the years so it’s also not a static metric.
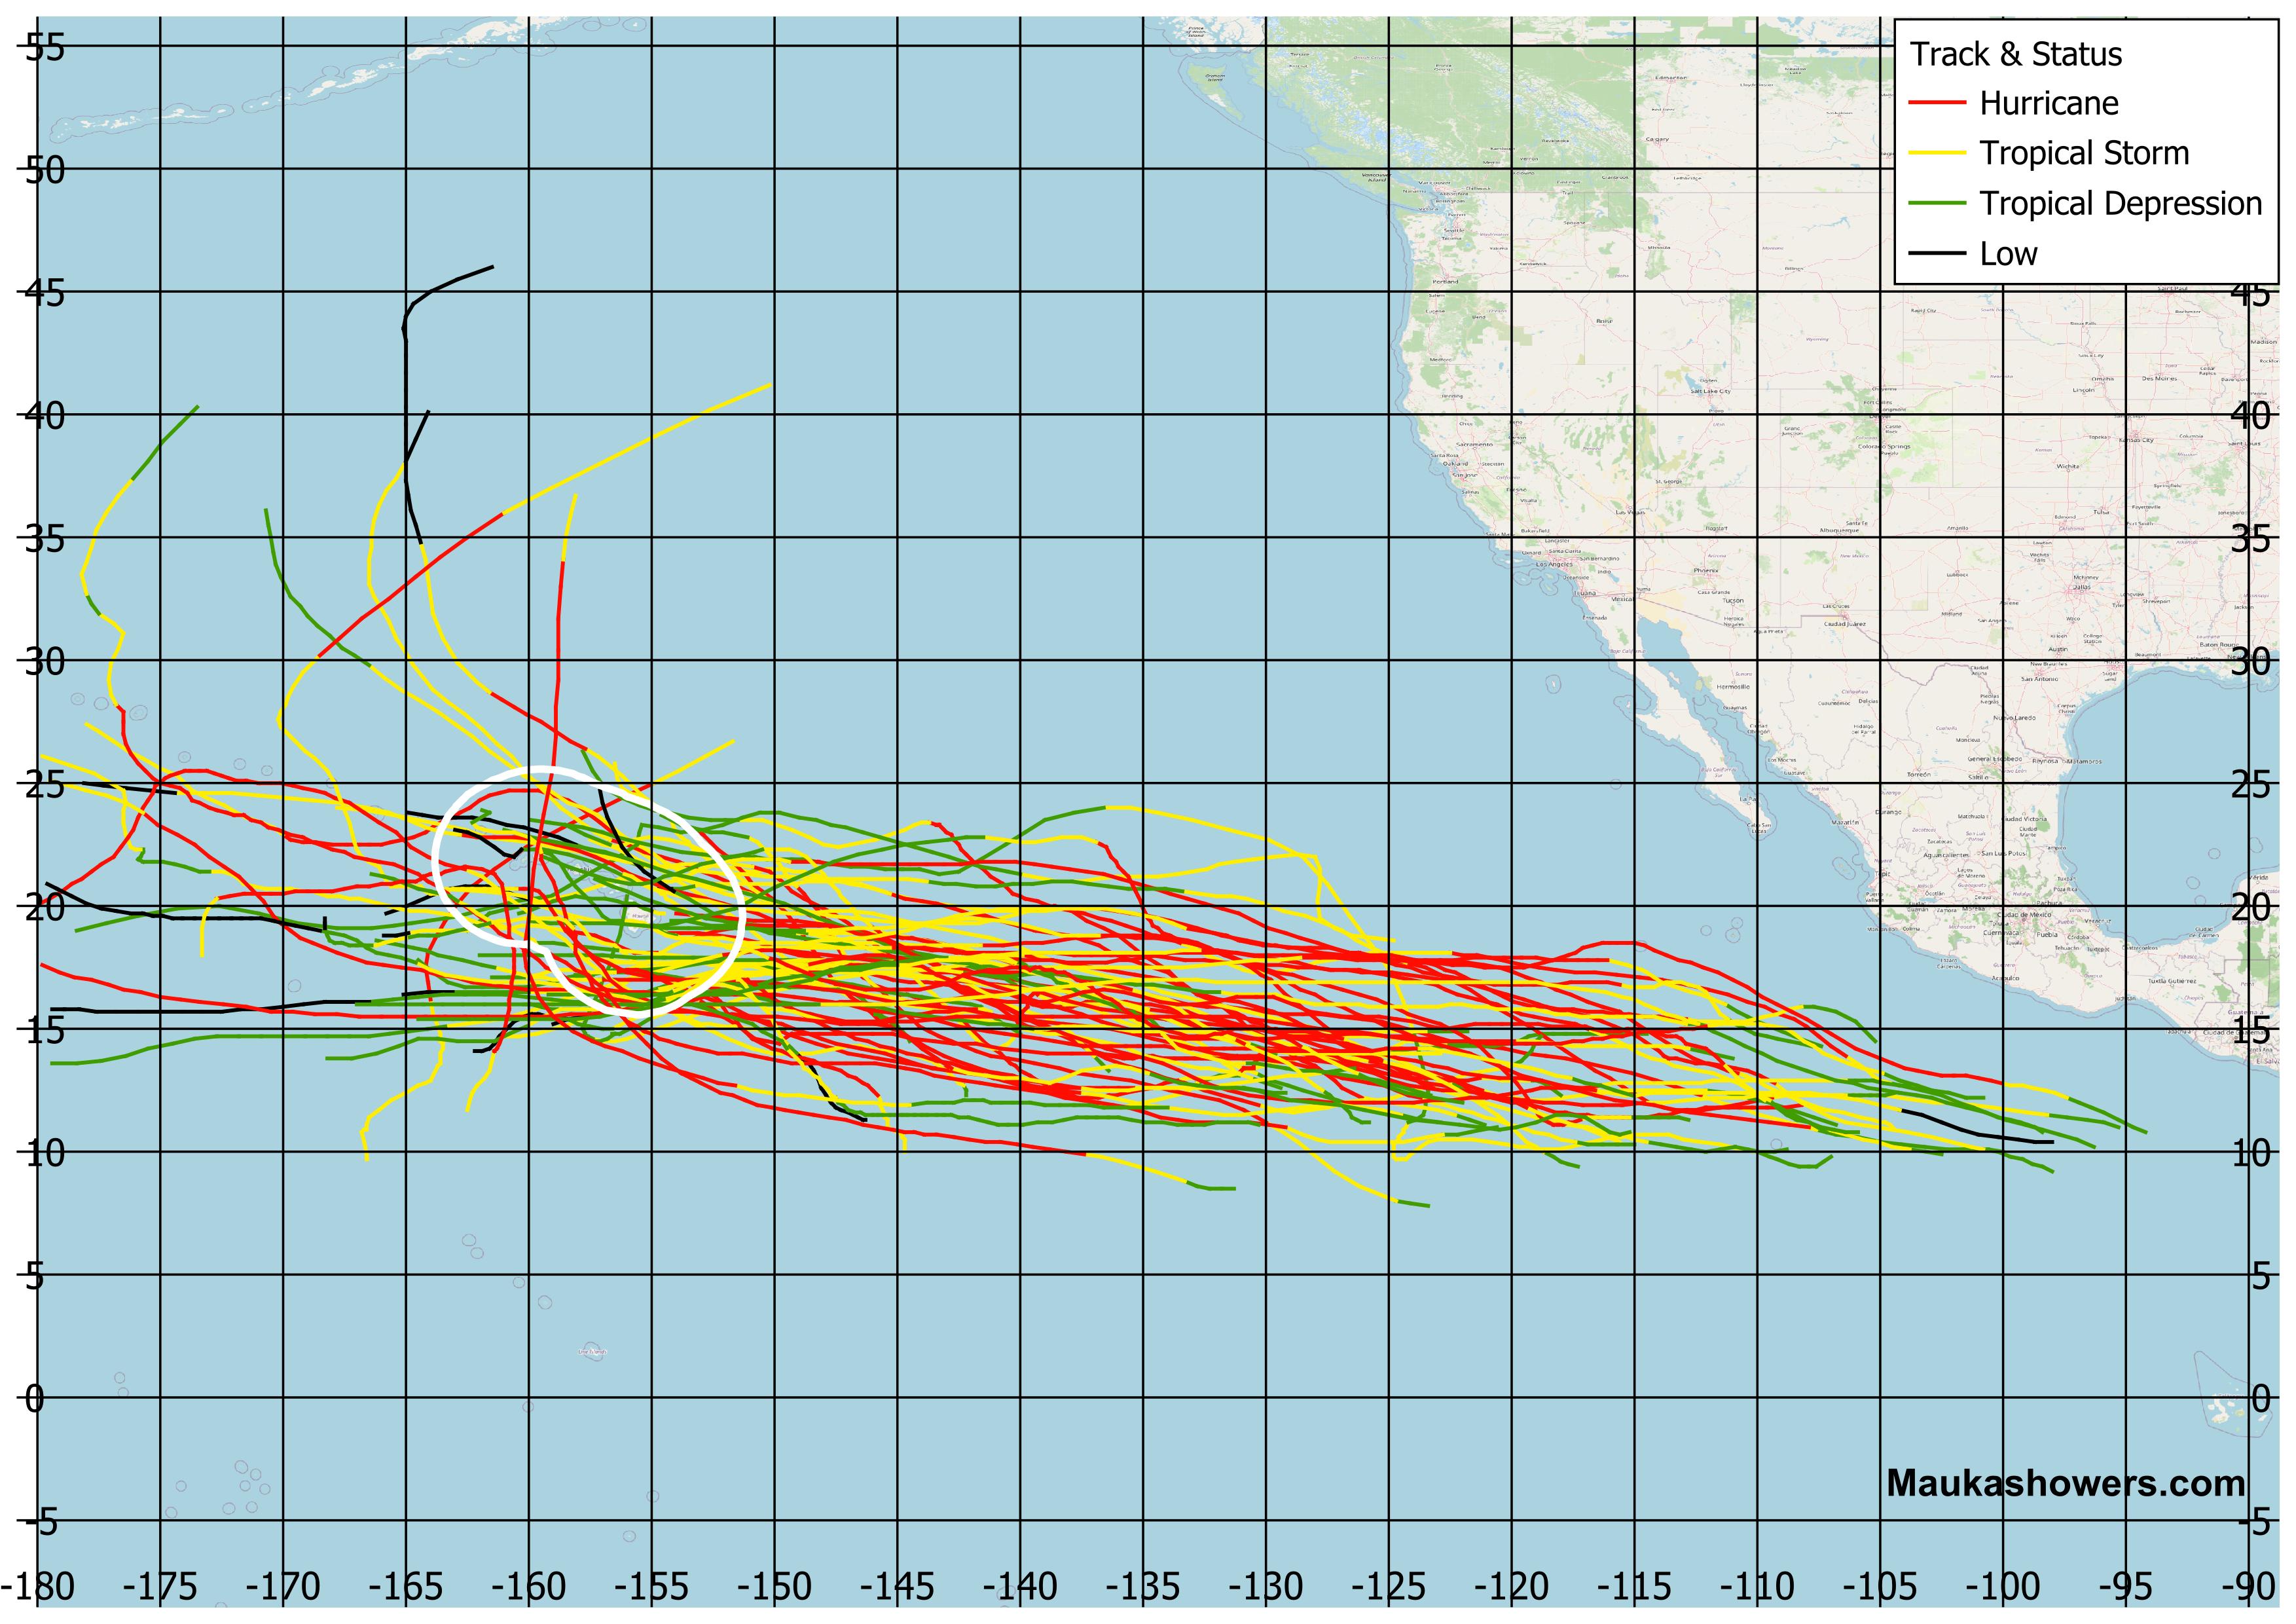
Using the 200 NM criterion and the International Best Track Archive for Climate Stewardship (IBTrACS) database there have been 69 tropical cyclones (shown below) that threatened the main Hawaiian Islands since 1950. Of these, 10 have been direct hits (center moved over land), including two that were hurricanes (Dot 1959, Iniki 1992). Others have had significant impacts even though the center remained offshore. These include Hurricane Iwa in 1982, which devastated Kauaʻi, and Hurricane Lane in 2018, which broke the record for the most rain from a tropical cyclone in Hawaiʻi.

Track graphic of tropical cyclones passing within 200 NM of the main Hawaiian Islands since 1950. The white line surrounding the islands marks the offshore waters 200 NM from land. Data for the graphic are from the International Best Track Archive for Climate Stewardship (IBTrACS) database hosted by the NOAA National Centers for Environmental Information (NCEI).
Where did these tropical cyclones come from? According to data from an article in Wikipedia, the east and central Pacific basins have had 1318 TCs from 1950 through 2025. I plotted all the tracks in the IBTrACS database, then selected only the 69, roughly 5% of the eastern and central Pacific total, that passed within 200 NM of the Hawaiian Islands. The map below shows these systems from where they were first declared to be a tropical depression to where they passed through the offshore waters and dissipated, became a post-tropical cyclone, or moved into the western Pacific. Not surprisingly, most came from the east Pacific basin. It is, after all, the second most active tropical cyclone basin in the world (the western Pacific is #1).

Same as above, but showing the full tracks of the 69 tropical cyclones passing within 200 NM of the main Hawaiian Islands.
Is there a region or zone within the eastern Pacific that spawns most of the systems that threaten Hawaiʻi? To show this, I filtered out the tracks by latitude-longitude boxes based on where they first became tropical depressions. Almost all of them started between 5.0N and 20.0N latitude, so these are used as the north-south boundaries. I then used 10 degree longitude intervals for the east-west boundaries. These plots are shown below. The highest number of tropical cyclone initiation points is between 5.0N to 20.0N latitude, from 120.0W to 129.9W longitude. There are 17 tropical cyclones in this box. Second highest is the box from 100.0W to 109.9W longitude with 15. Fausto, which is not plotted here, came from this region. The box between these two, from 110.0W to 119.9W has 11, which is interesting to me because I would have expected the highest and second highest boxes to be adjacent to each other. The number of systems originating to the east and west of these three boxes is quite a bit lower.
There’s only one tropical cyclone in the 150.0W to 159.9W box and it’s an interesting one. It’s an unnamed system in 1958 that originated just east of the Big Island, made landfall north of Hilo, then moved west into the leeward waters of the state and dissipated. In Shaw (1981), it states that, “On August 7, a tropical storm suddenly appeared immediately off Hilo on the island of Hawaiʻi.” I suspect this tropical cyclone actually developed much farther to the southeast. This occurred before weather satellite data were routinely available and could have gone undetected until well after it initially developed. Thank goodness we have satellite data easily available now! Tropical cyclones originating southwest of the Hawaiian Islands are late season systems. They became threats to the state because they were drawn northward or northeastward from large wet season low pressure systems northwest of the island chain.

Map showing the full tracks of tropical cyclones passing within 200 NM of the main Hawaiian Islands and originating in the box between 5N and 20N latitude from 90.0W to 99.9W longitude.

Same as previous, but for 100.0 to 109.9W longitude band.

Same as previous, but for 110.0 to 119.9W longitude band.

Same as previous, but for 120.0 to 129.9W longitude band.

Same as previous, but for 130.0 to 139.9W longitude band.

Same as previous, but for 140.0 to 149.9W longitude band.

Same as previous, but for 150.0 to 159.9W longitude band.

Same as previous, but for 160.0 to 169.9W longitude band. There were no tropical cyclones that threatened Hawaiʻi west of this band.
In addition to showing where the tropical cyclone threats came from, I thought it would be interesting to look at the number of systems that threaten the state compared to the total number of systems in the central Pacific by year. I’ve shown variations of the bar graph below in previous posts, but this time I included the number of tropical cyclones that moved into the offshore waters.
Since 1970, most years have at least one tropical cyclone that threatens the state. There are a couple of other things I take away from this graph. One is that the number of threatening systems does not appear to be related to the ENSO cycle. Yes, there are more tropical cyclones in the central Pacific during El Niño years, but that doesn’t necessarily mean we will have more tropical cyclones getting close to the main Hawaiian Islands. For example, 1997, 2002, and 2004, all El Niño years, had no tropical cyclones pass within Hawaiʻi’s offshore waters. In 2015, a very strong El Niño year, there were four systems that threatened the state, but none got close enough to warrant the issuance of a Tropical Storm Warning or a Hurricane Warning. In the following year, which had La Niña conditions, three entered the offshore waters, one of which made landfall on the Big Island (Tropical Storm Darby). The 2018 season occurred during ENSO-neutral conditions (between El Niño and La Niña) and there were six central Pacific tropical cyclones that year. Half of them moved into the offshore waters, including Tropical Storm Olivia, which made landfall twice in Maui County (Maui and Lānaʻi), and the previously mentioned Hurricane Lane. The third system was Hurricane Hector, which passed south of the Big Island.
Another take-away is that the number of tropical cyclones for the central Pacific basin predicted at the start of the season, usually as part of a press conference, is a poor indicator for how much at risk the state is for that year. Below normal seasonal activity can be predicted, and you can have just one system the whole year, but that lone system can threaten the state, as happened in 2022. This is why the National Weather Service often says, “it just takes one.”

Graph of the annual number of tropical cyclones in the central Pacific from 1970 through 2025. Red bars indicate El Niño during July-August-September (JAS), blue bars indicate La Niña, and yellow bars indicate ENSO neutral. The black hatched bars indicate the number of cyclones that passed within 200 NM of the main Hawaiian Islands. Data provided by the Central Pacific Hurricane Center and the IBTrACS database. Bar colors based on Relative ONI (RONI) data from CPC.
To close out on the lighter side, I wanted to mention that “Flossie” is the name of the tropical cyclone that has threatened the Hawaiian Islands the most. These instances happened in 2007, 2013, and 2019. Considering the naming lists have a six year rotation, it’s rather amazing that Flossie got close to the state on three consecutive chances. However, in 2025, Flossie remained in the far east Pacific and moved parallel to the coast of Mexico. Five others, Daniel, Darby, Denise, Gilma, and Jova, threatened the islands twice. Going into this I thought Daniel had more than two since it seemed like we were always worried about Daniel but I guess not.
Reference
Shaw, S. L., 1981: A history of tropical cyclones in the central North Pacific and the Hawaiian Islands: 1832-1979. NOAA, 137 pp.